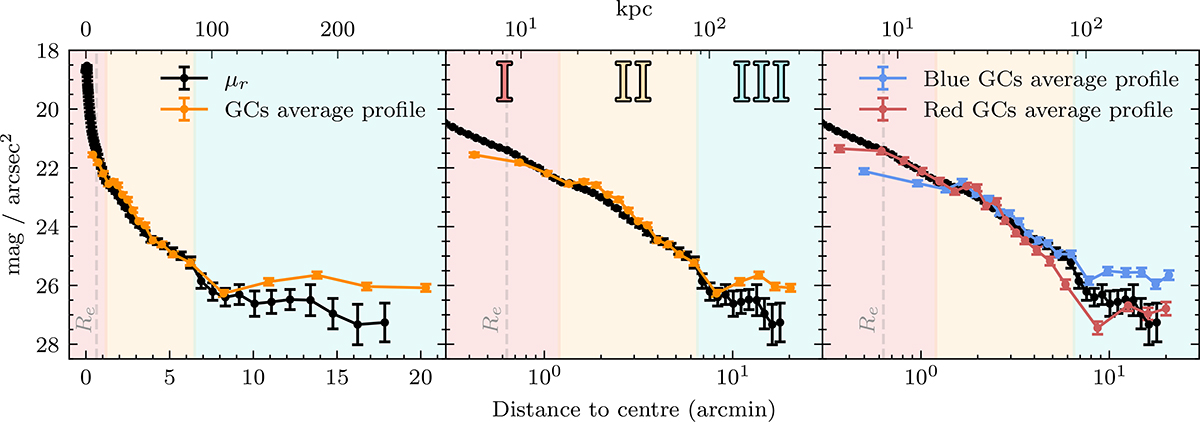
Fig. 8.
Download original image
Number density profile of GCs and the surface brightness profile of NGC 3311 (black points). The left and central panels show the number density profile considering all GC candidates (orange points) with a linear and logarithmic distance scale, respectively. The three different regimes of the GC number density are indicated with filled colours, and are more clearly distinguished in the middle panel. The right panel shows the number density profiles of red and blue GCs separately, and showcases how the red GCs follow the starlight while blue GCs follow a faint, diffuse component. All the number density profiles were arbitrarily shifted to best match the surface brightness profile in the central regime. The grey dashed line indicates the effective radius of NGC 3311.
Current usage metrics show cumulative count of Article Views (full-text article views including HTML views, PDF and ePub downloads, according to the available data) and Abstracts Views on Vision4Press platform.
Data correspond to usage on the plateform after 2015. The current usage metrics is available 48-96 hours after online publication and is updated daily on week days.
Initial download of the metrics may take a while.