Fig. 1
Download original image
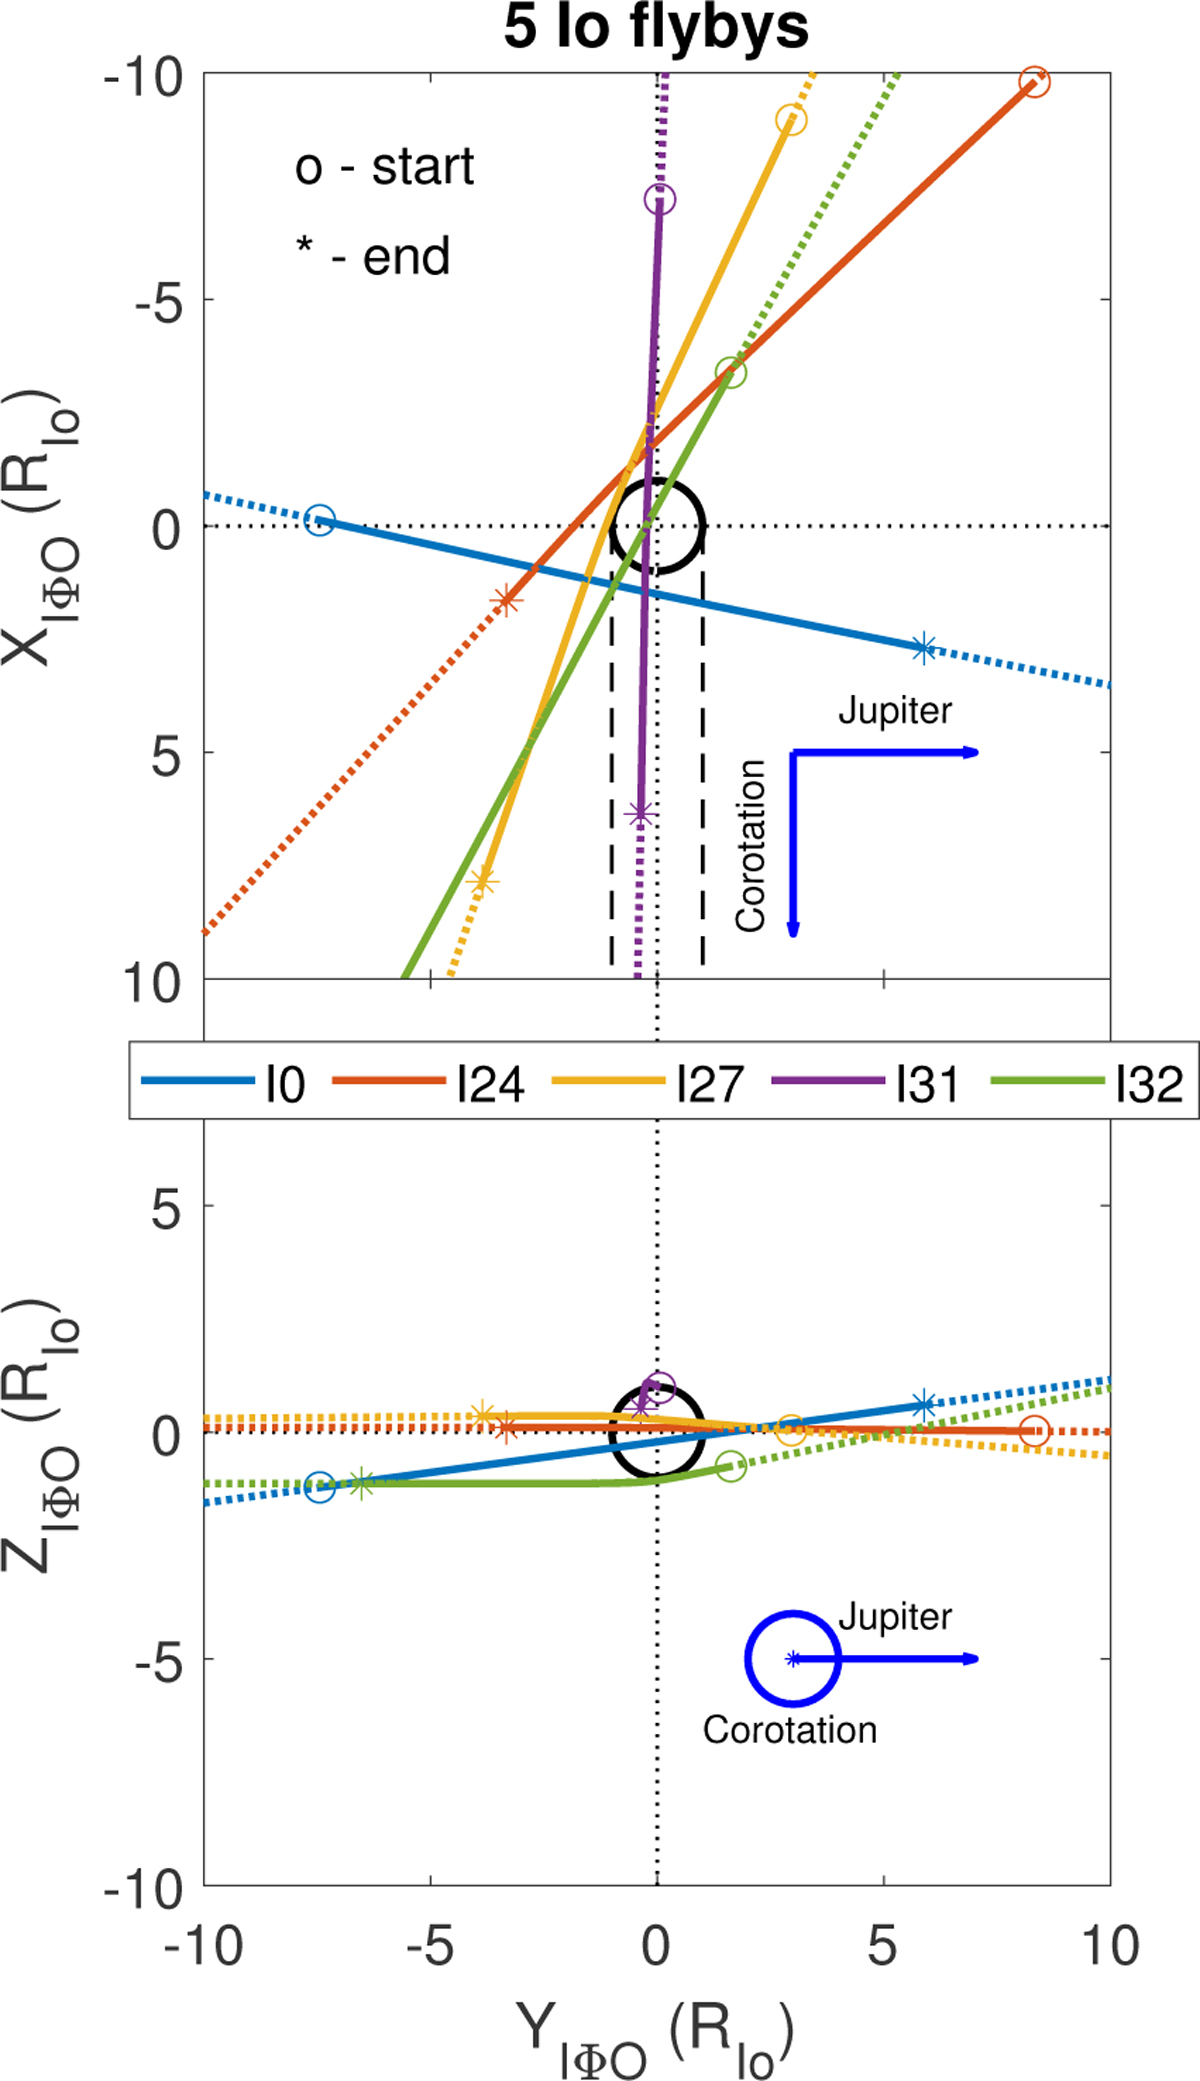
Five Io flybys used in this study for which magnetometer data are available. The orbits are shown as dotted lines projected onto the IΦO YX-plane (top) and YZ-plane (bottom). The solid intervals show the region over which high-resolution magnetometer data are available. The two dashed black lines at YIΦO = ±1 show the geometrical wake downstream of Io.
Current usage metrics show cumulative count of Article Views (full-text article views including HTML views, PDF and ePub downloads, according to the available data) and Abstracts Views on Vision4Press platform.
Data correspond to usage on the plateform after 2015. The current usage metrics is available 48-96 hours after online publication and is updated daily on week days.
Initial download of the metrics may take a while.