Open Access
Fig. 12
Download original image
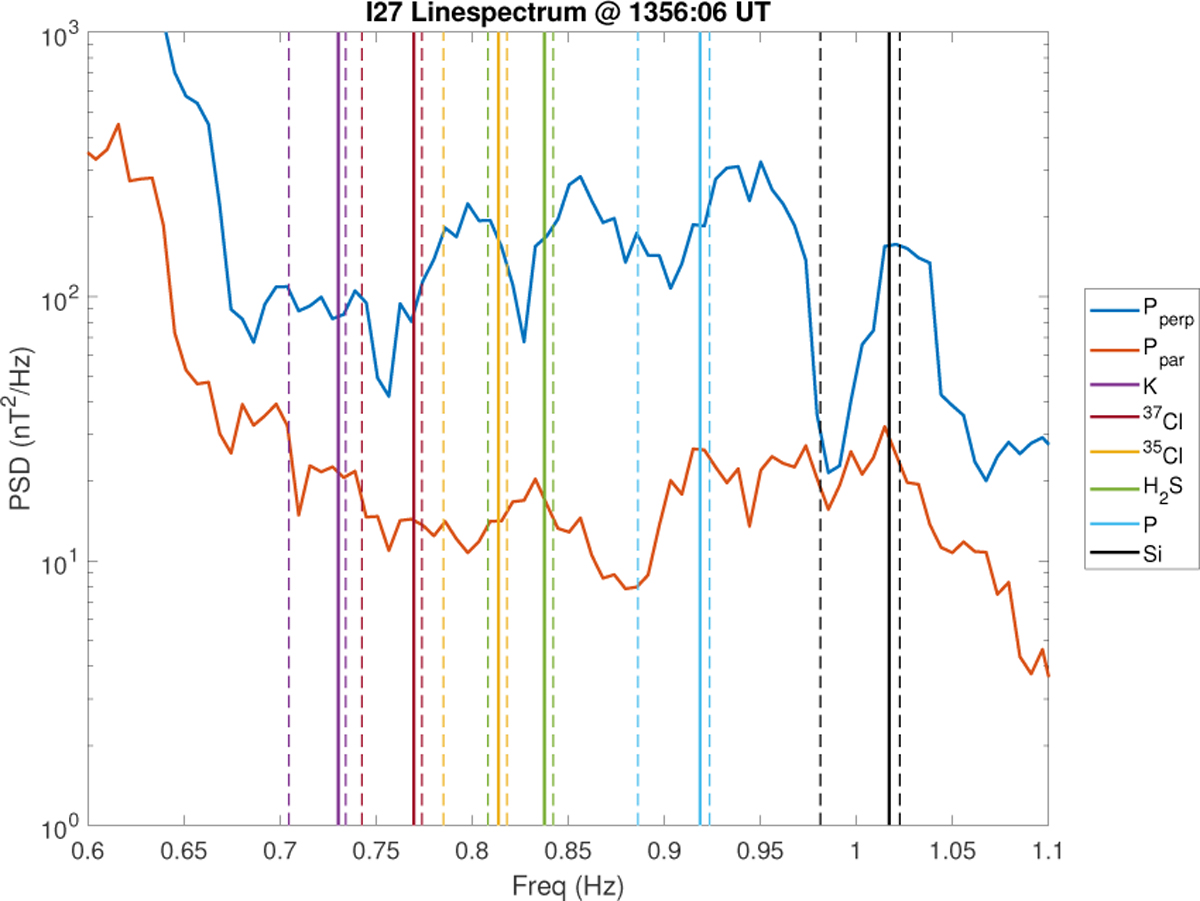
Zoom-in on the line spectrum of I27 in Fig. 9. The solid vertical lines show the cyclotron frequencies and the dashed vertical lines show the window over which the spectral power in the peak is calculated.
Current usage metrics show cumulative count of Article Views (full-text article views including HTML views, PDF and ePub downloads, according to the available data) and Abstracts Views on Vision4Press platform.
Data correspond to usage on the plateform after 2015. The current usage metrics is available 48-96 hours after online publication and is updated daily on week days.
Initial download of the metrics may take a while.