Fig. 2
Download original image
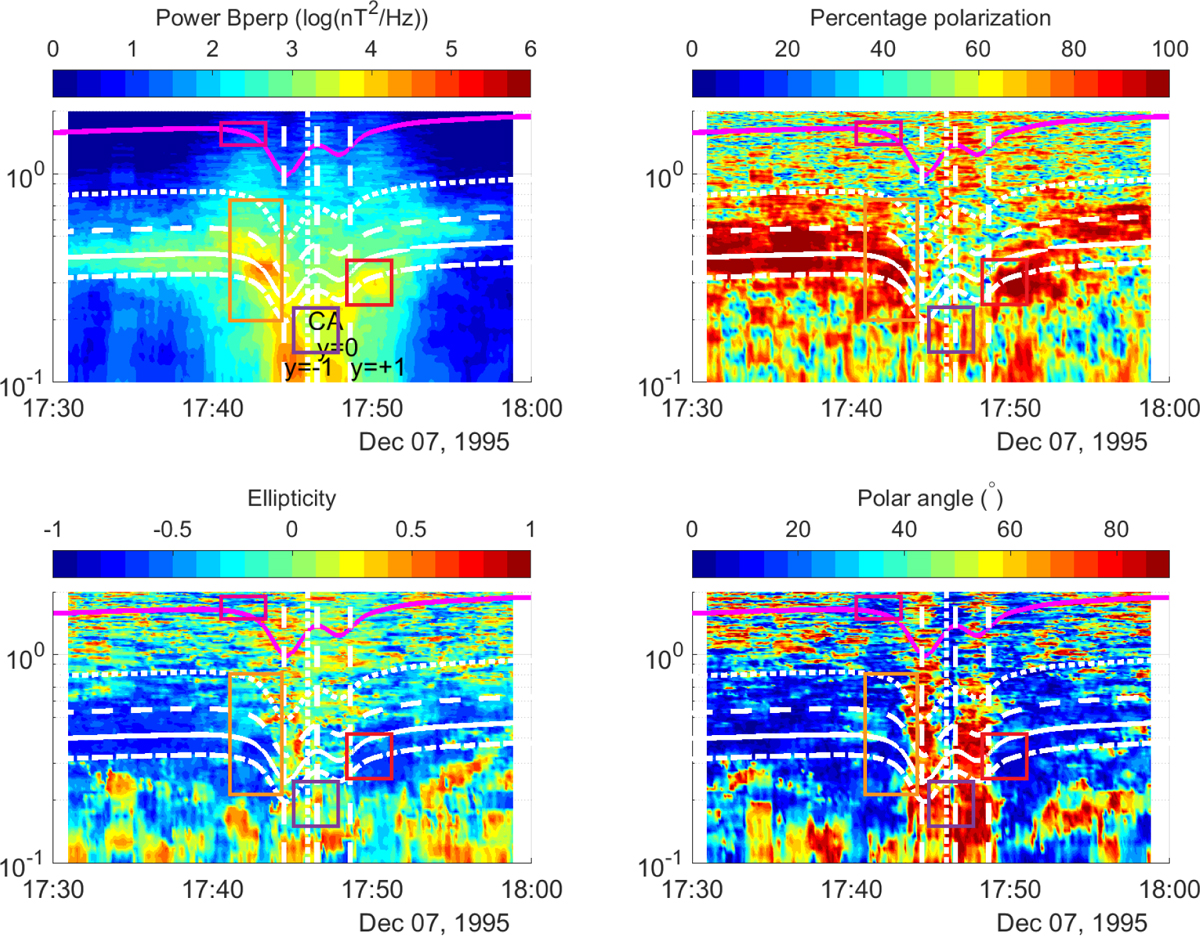
Overview of the I0 flyby. The spectrograms show the perpendicular power density, polarization, ellipticity, and polar angle. The white lines show the cyclotron frequency of S+ (dotted), SO+ (dashed) ![]() (solid), and
(solid), and ![]() (dash-dotted) and the magenta line O+. The orange box shows an interval of
(dash-dotted) and the magenta line O+. The orange box shows an interval of ![]() wave activity, the purple box mirror modes in Io’s wake region, and the red box a period of
wave activity, the purple box mirror modes in Io’s wake region, and the red box a period of ![]() wave activity. Details about the orange, red, and purple boxes are given in Fig. 3.
wave activity. Details about the orange, red, and purple boxes are given in Fig. 3.
Current usage metrics show cumulative count of Article Views (full-text article views including HTML views, PDF and ePub downloads, according to the available data) and Abstracts Views on Vision4Press platform.
Data correspond to usage on the plateform after 2015. The current usage metrics is available 48-96 hours after online publication and is updated daily on week days.
Initial download of the metrics may take a while.