Fig. 3
Download original image
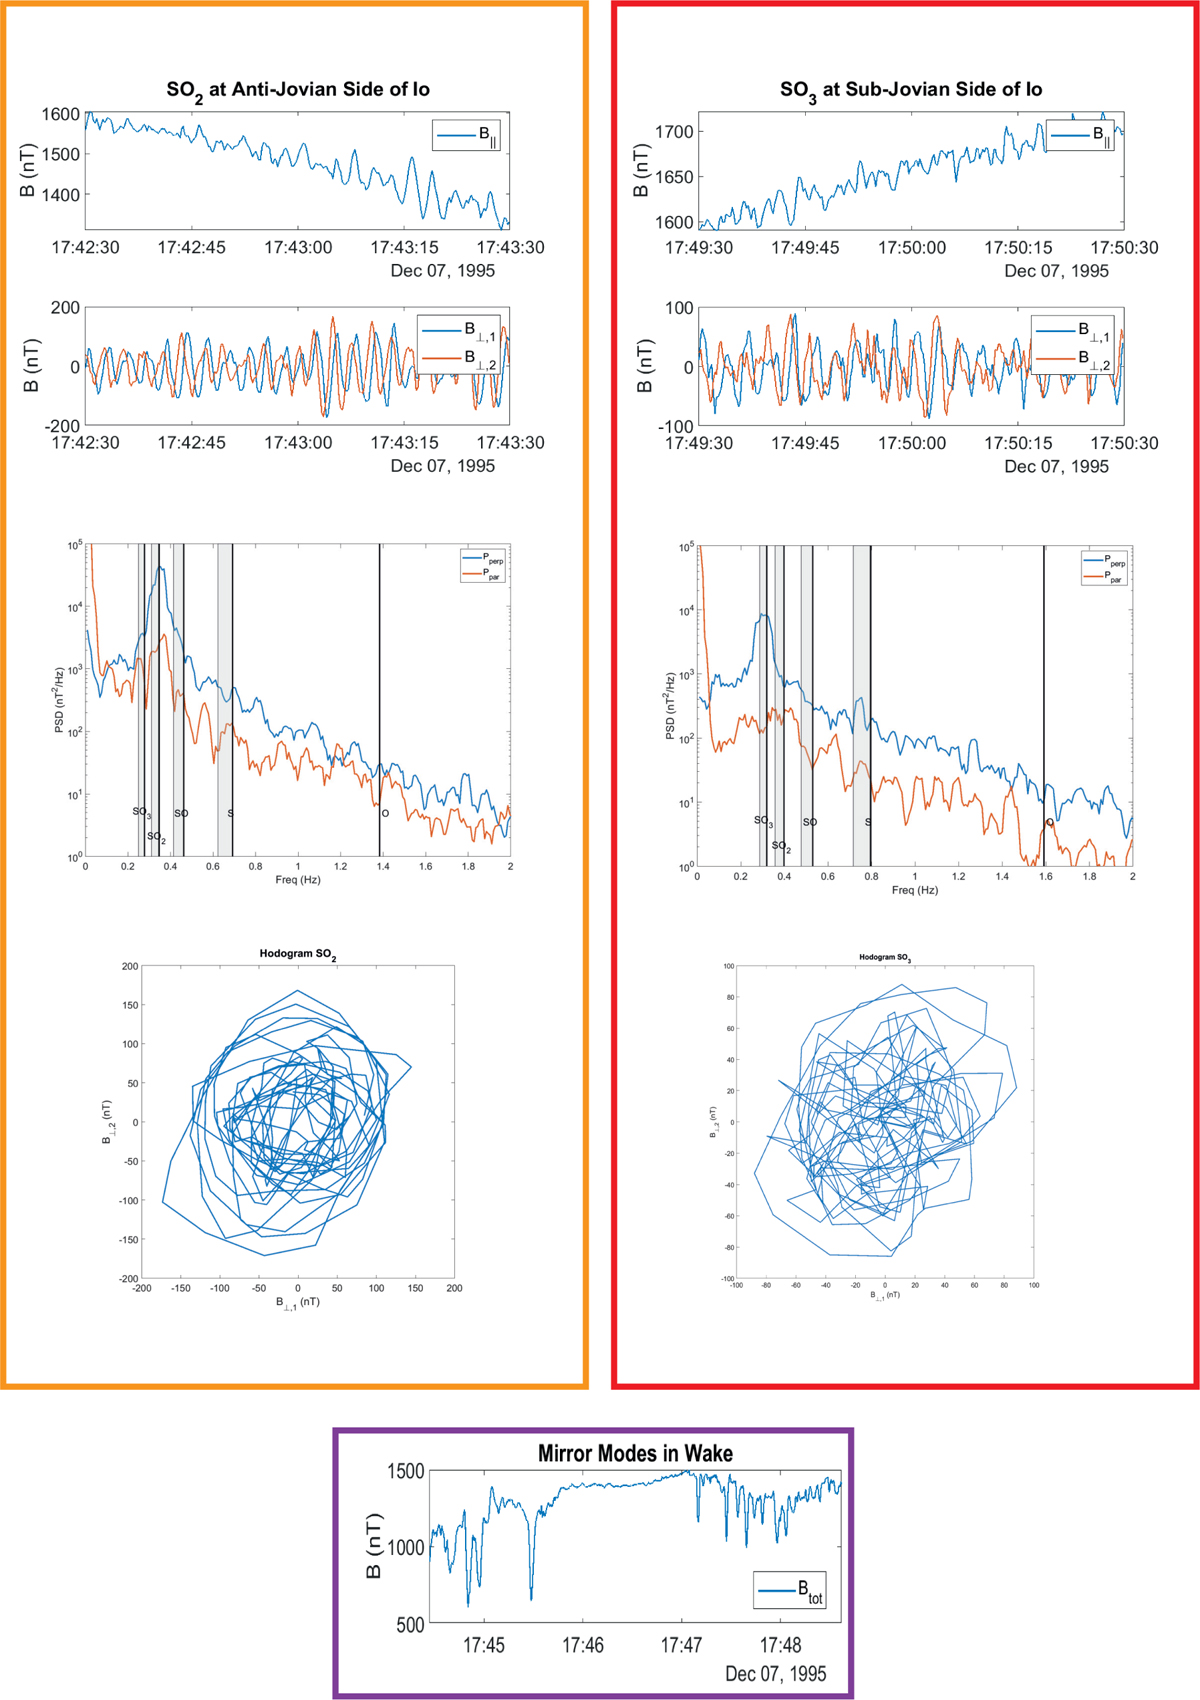
Details about the orange, red, and purple boxes in Fig. 2. The orange box shows an interval with ![]() cyclotron waves. The panels within the box show, from top to bottom: the MFA parallel magnetic field strength; the two MFA perpendicular magnetic field components; the power spectrum (with the cyclotron frequency of the sulfur-bearing ions shown by a black vertical line and the grey shaded area the interval over which the total spectral power is integrated); and a hodogram of the two MFA perpendicular magnetic field components. The red box shows the same for an interval with predominantly
cyclotron waves. The panels within the box show, from top to bottom: the MFA parallel magnetic field strength; the two MFA perpendicular magnetic field components; the power spectrum (with the cyclotron frequency of the sulfur-bearing ions shown by a black vertical line and the grey shaded area the interval over which the total spectral power is integrated); and a hodogram of the two MFA perpendicular magnetic field components. The red box shows the same for an interval with predominantly ![]() cyclotron waves. The purple box shows the mirror mode waves in Io’s wake region.
cyclotron waves. The purple box shows the mirror mode waves in Io’s wake region.
Current usage metrics show cumulative count of Article Views (full-text article views including HTML views, PDF and ePub downloads, according to the available data) and Abstracts Views on Vision4Press platform.
Data correspond to usage on the plateform after 2015. The current usage metrics is available 48-96 hours after online publication and is updated daily on week days.
Initial download of the metrics may take a while.