Fig. 5
Download original image
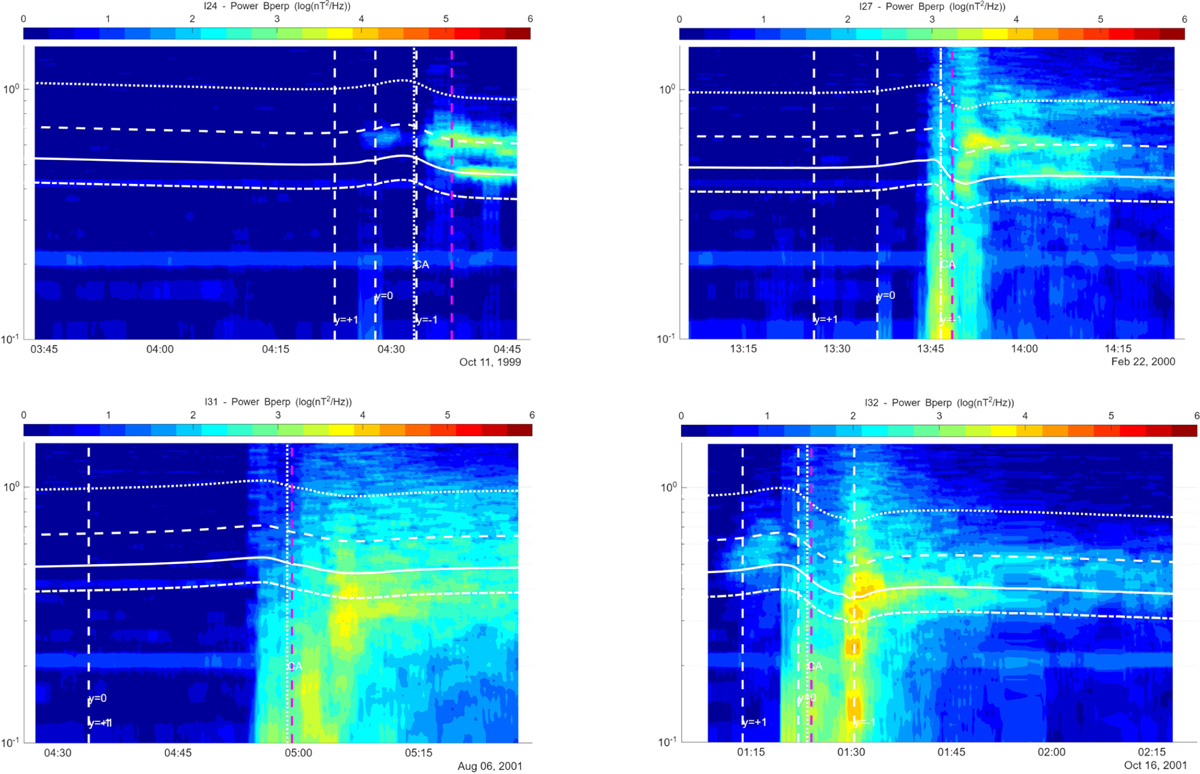
Spectral analysis of the I24, I27, I31, and I32 Io flybys. The local cyclotron frequencies for ![]() ,
, ![]() , SO+, and S+ ions are overlaid in white lines (dash-dot, solid, dashed, and dotted). The vertical lines show the location of the geometrical wake (white dashed), and closest approach (white dotted) and the location where Galileo moves from upstream to downstream of Io (X = 0, magenta dashed).
, SO+, and S+ ions are overlaid in white lines (dash-dot, solid, dashed, and dotted). The vertical lines show the location of the geometrical wake (white dashed), and closest approach (white dotted) and the location where Galileo moves from upstream to downstream of Io (X = 0, magenta dashed).
Current usage metrics show cumulative count of Article Views (full-text article views including HTML views, PDF and ePub downloads, according to the available data) and Abstracts Views on Vision4Press platform.
Data correspond to usage on the plateform after 2015. The current usage metrics is available 48-96 hours after online publication and is updated daily on week days.
Initial download of the metrics may take a while.