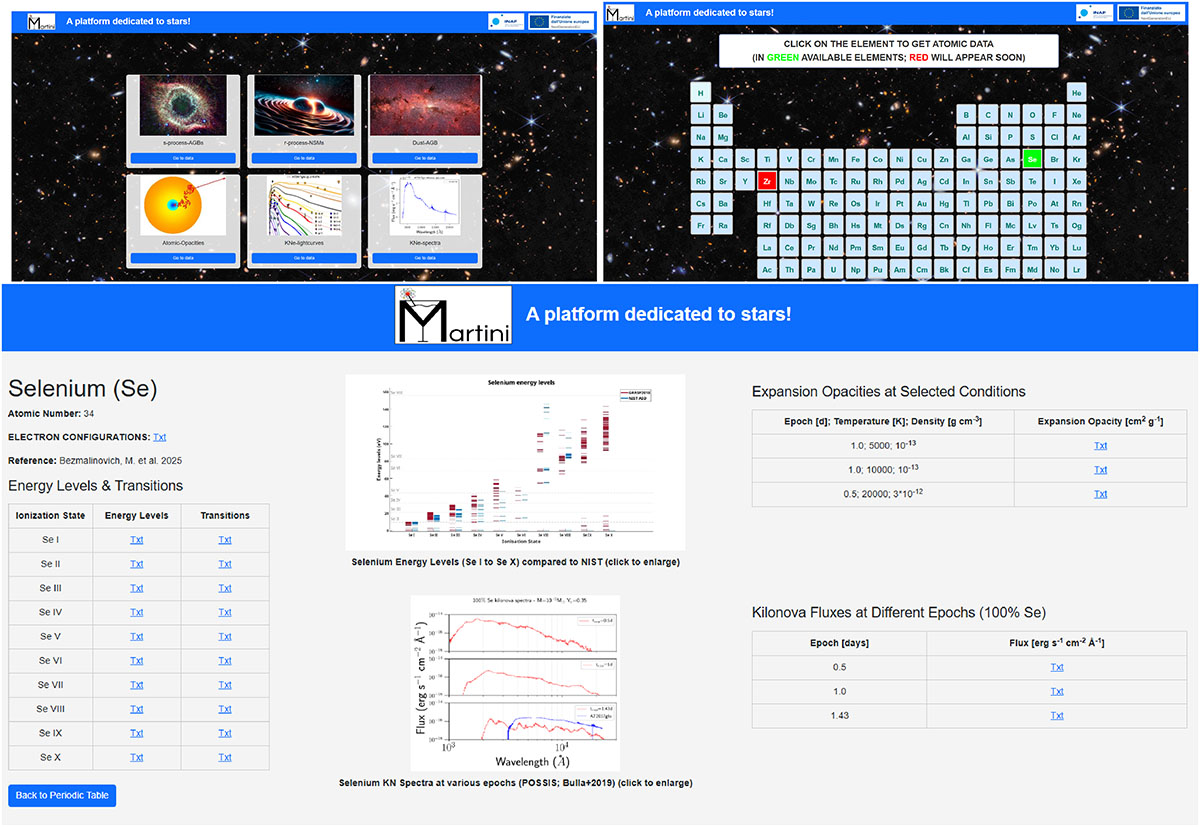
Fig. 11.
Download original image
Images of the MARTINI platform. Panel (a): homepage of the platform with all the different fields of interest, from s-process to KN light curves. Panel (b): periodic table appearing as intermediate window after the topic selection. Here the user must select one of the available elements (in green) to move to the data page. Panel (c): detailed Se example of the data page. On this page all the literature references, the ‘.txt’ data files, and plots are reported.
Current usage metrics show cumulative count of Article Views (full-text article views including HTML views, PDF and ePub downloads, according to the available data) and Abstracts Views on Vision4Press platform.
Data correspond to usage on the plateform after 2015. The current usage metrics is available 48-96 hours after online publication and is updated daily on week days.
Initial download of the metrics may take a while.