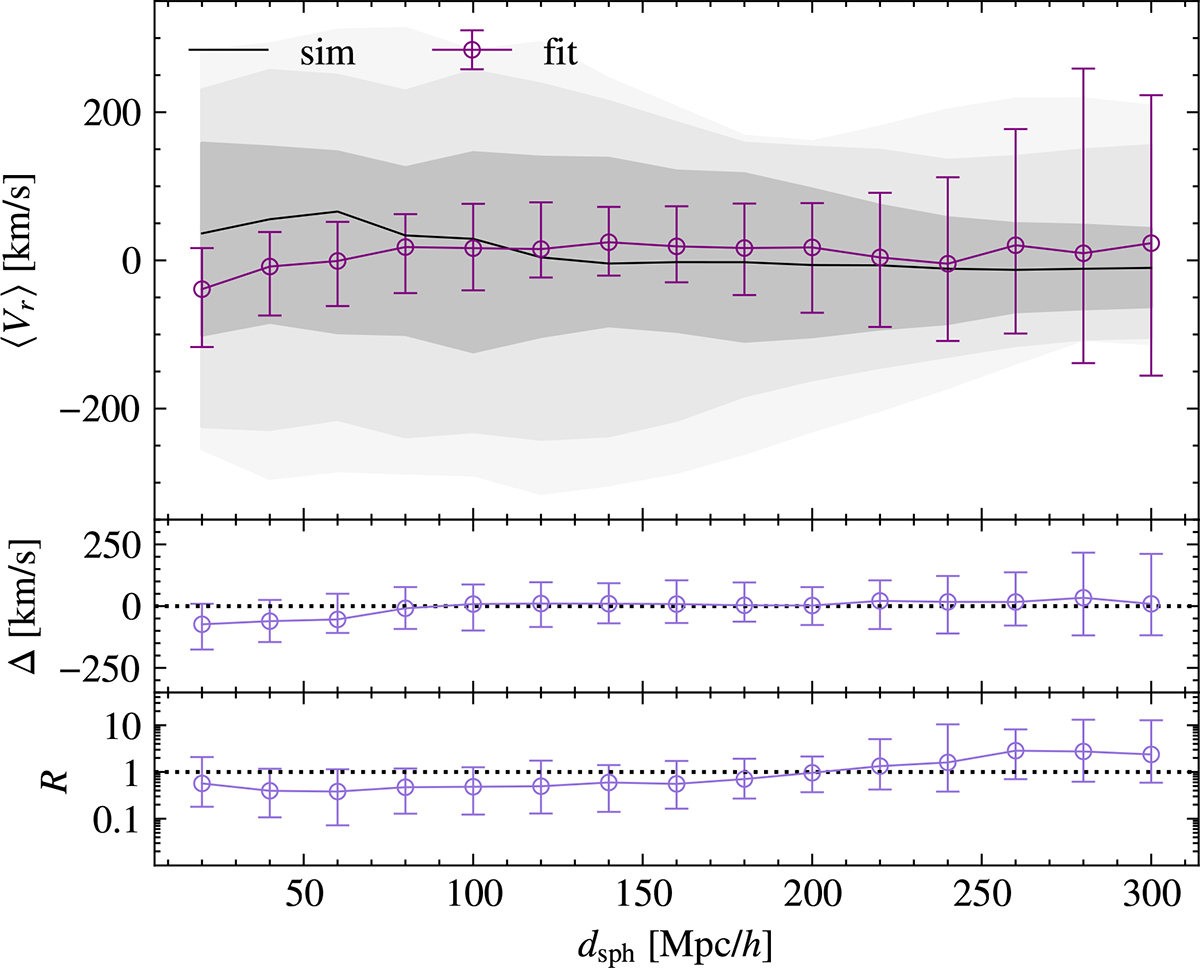
Fig. 3.
Download original image
Comparison between the average radial peculiar velocity from the simulation and the fit results. In the top panel, the black line represents the median of the true value across 64 mocks, with the shaded gray regions indicating 68%–95%–99.7% percentile intervals, equivalent to 1, 2, and 3σ. The purple error bars represent the median of the fit results, with 68% error bars. The middle and bottom rows show the difference Δ and ratio R between the estimated and simulation values, respectively. For each of these parameters, the median across the 64 mocks is shown by the central light purple line, with error bars indicating the percentile interval covering the central 68% of the distribution.
Current usage metrics show cumulative count of Article Views (full-text article views including HTML views, PDF and ePub downloads, according to the available data) and Abstracts Views on Vision4Press platform.
Data correspond to usage on the plateform after 2015. The current usage metrics is available 48-96 hours after online publication and is updated daily on week days.
Initial download of the metrics may take a while.