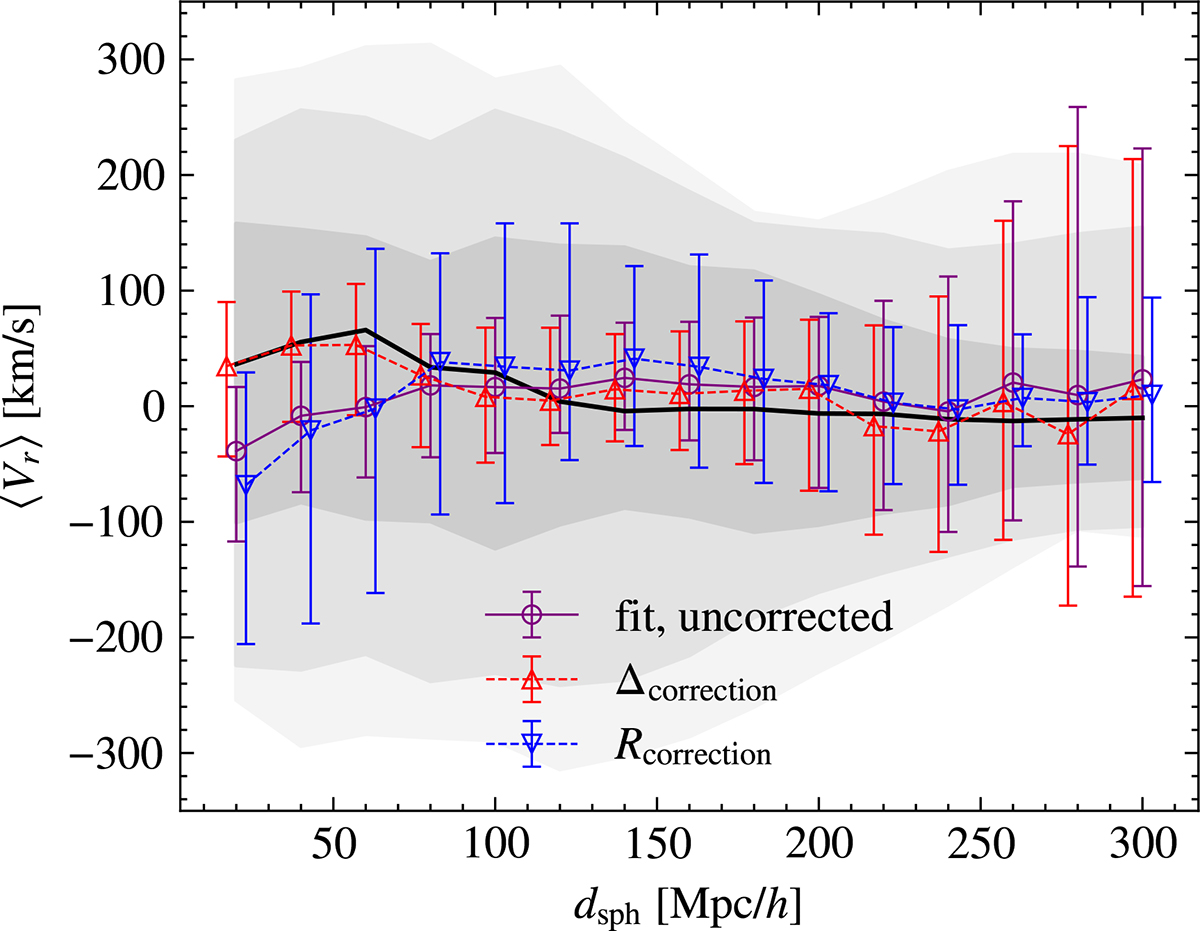
Fig. 5.
Download original image
Application of the corrections to the radial flow fit of the mocks. The median of the radial flow in the simulation, expected to be minimal, among the mocks is shown as a black line, with gray shades indicating the 68%–95%–99.7% intervals demonstrating the cosmic variance. Corrections based on differences and ratios are shown as dashed red and blue lines, respectively, with error bars indicating the 68% interval across the 64 corrected radial flows.
Current usage metrics show cumulative count of Article Views (full-text article views including HTML views, PDF and ePub downloads, according to the available data) and Abstracts Views on Vision4Press platform.
Data correspond to usage on the plateform after 2015. The current usage metrics is available 48-96 hours after online publication and is updated daily on week days.
Initial download of the metrics may take a while.