Fig. 7.
Download original image
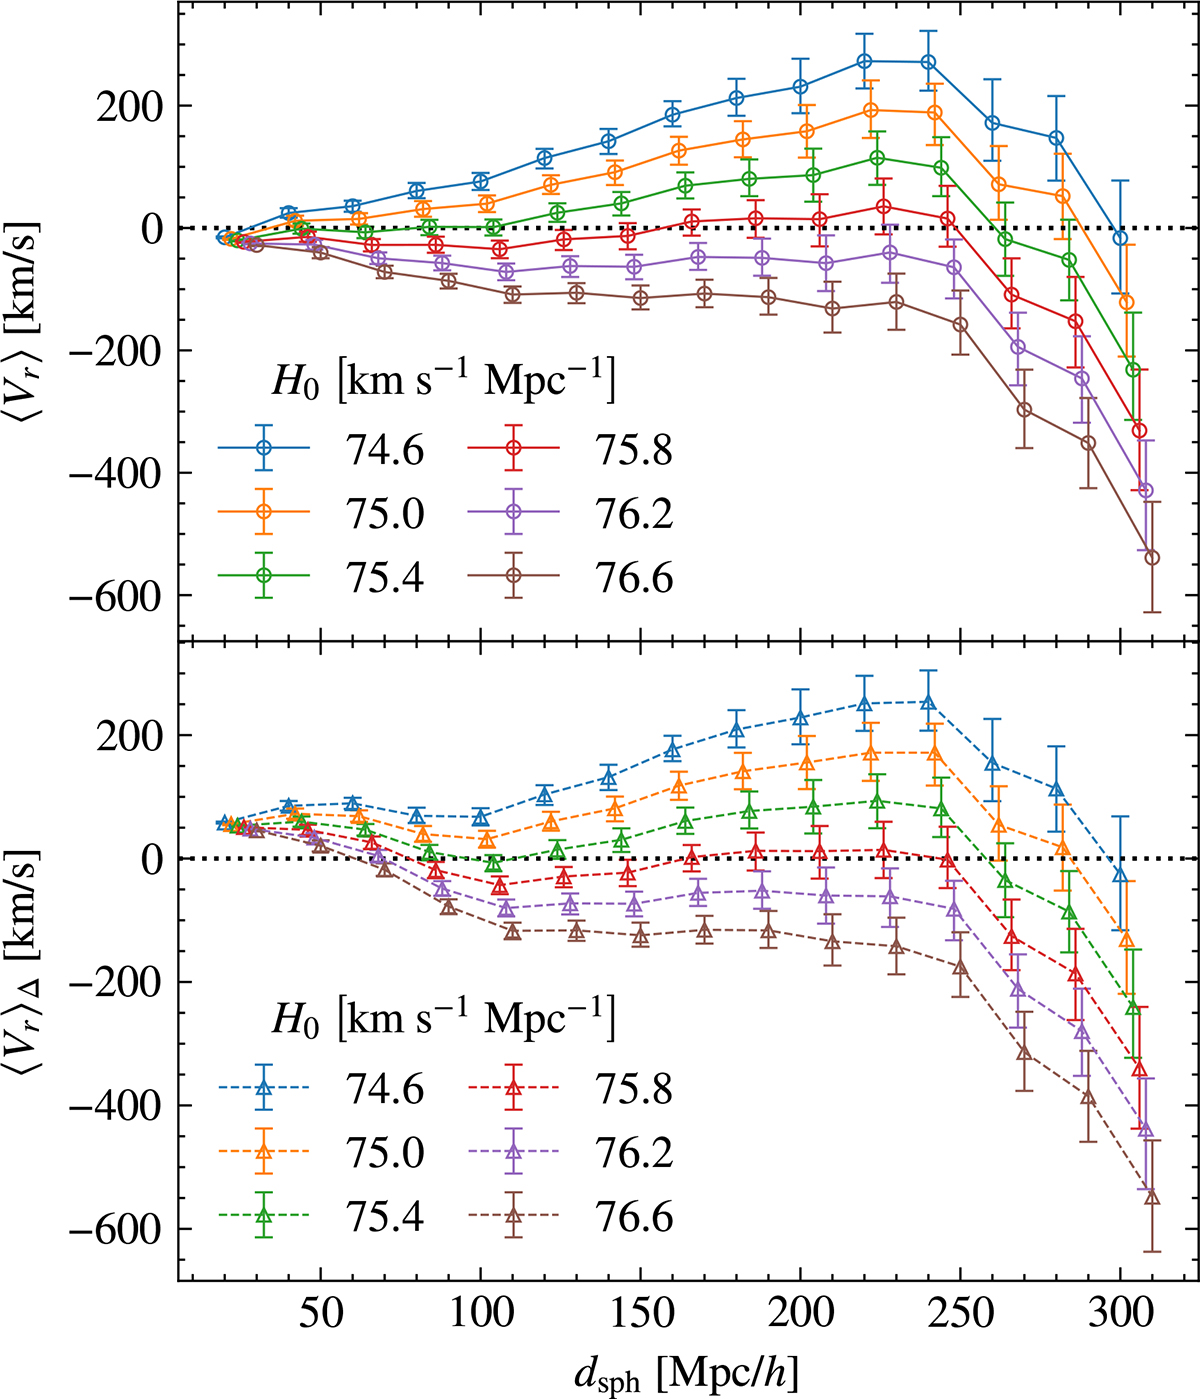
Radial flow fit of the CF4 data. The top panel shows the result directly from the forward modeling as solid lines, and the bottom panel shows the Δ-corrected result as dashed lines. Each line, corresponding to a different value of H0 assumed in the model, is distinguished by color. The error bars are the 68% interval of the Monte Carlo steps.
Current usage metrics show cumulative count of Article Views (full-text article views including HTML views, PDF and ePub downloads, according to the available data) and Abstracts Views on Vision4Press platform.
Data correspond to usage on the plateform after 2015. The current usage metrics is available 48-96 hours after online publication and is updated daily on week days.
Initial download of the metrics may take a while.