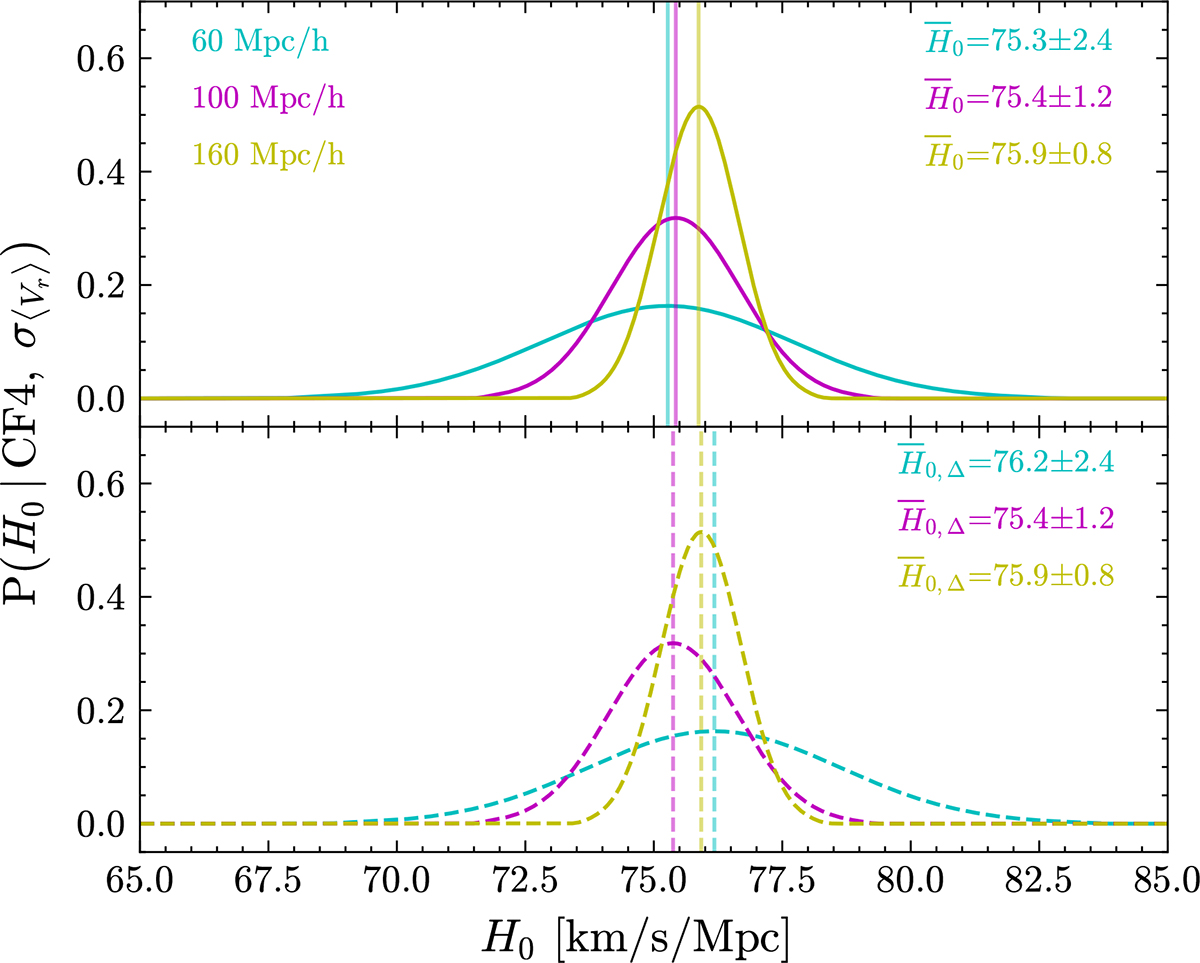
Fig. 8.
Download original image
Probability distribution of the Hubble constant given the CF4 data and ΛCDM radial flow variance at different sphere radii shown in colors, with μ ± 1σ of each curve. The vertical lines emphasize the curve mean. The marginalized likelihood function is proportional to the (un-) corrected radial flow distribution, whose resulting distributions are shown in the (top) bottom panel.
Current usage metrics show cumulative count of Article Views (full-text article views including HTML views, PDF and ePub downloads, according to the available data) and Abstracts Views on Vision4Press platform.
Data correspond to usage on the plateform after 2015. The current usage metrics is available 48-96 hours after online publication and is updated daily on week days.
Initial download of the metrics may take a while.