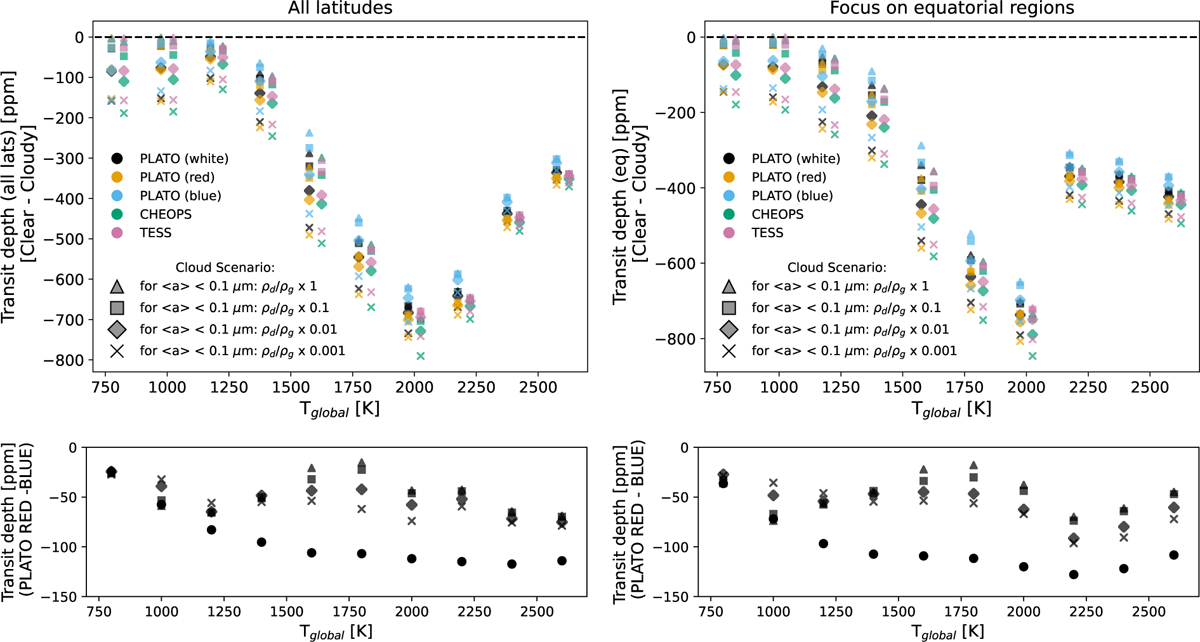
Fig. 12
Download original image
Transit depth differences between cloudy and clear scenarios. Top: differences between (planetary) average transit depths of clear and cloudy atmosphere scenarios for tidally locked planets with Tglobal = 800 K… 2600 K orbiting G main sequence stars (left: all latitudes are used, right: only equatorial information is used). The cloud mass loads, ρg/ρd(z), in atmospheric layers where 〈a〉 < 0.1 μm are denoted by different markers (crosses: 10−3ρg/ρd(z), diamonds: 10−2ρg/ρd(z), squares: 0.1ρg/ρd(z)). Triangles denote Fe-free results with full ρg/ρd(z). Colors denote different telescopes with optical band passes (black: PLATO’s white band, golden: PLATO’s red filter, blue: PLATO’s blue filter, green: CHEOPS, pink: TESS. The PLATO data has been offset horizontally by −25 K and the TESS/CHEOPS data by +25 K, respectively, for better visibility.). Bottom: average transit depths differences between PLATO’s red and blue filter for cloudy (crosses, diamonds, squares, triangles) and clear atmosphere calculations (circles).
Current usage metrics show cumulative count of Article Views (full-text article views including HTML views, PDF and ePub downloads, according to the available data) and Abstracts Views on Vision4Press platform.
Data correspond to usage on the plateform after 2015. The current usage metrics is available 48-96 hours after online publication and is updated daily on week days.
Initial download of the metrics may take a while.