Fig. 17
Download original image
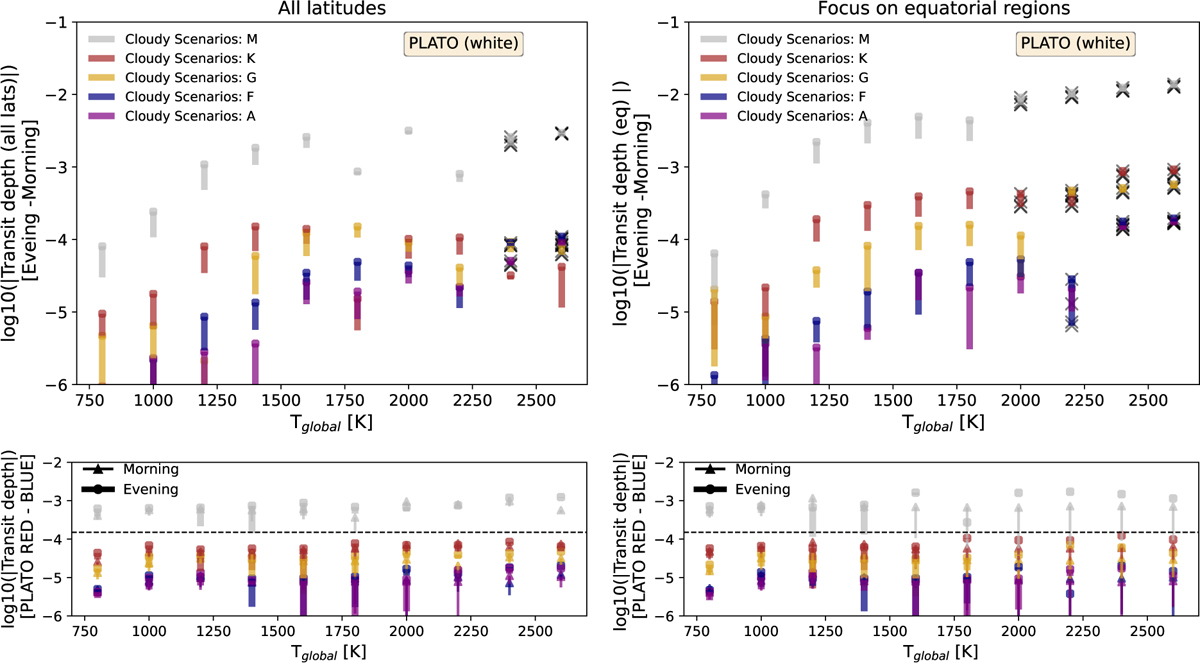
Transit asymmetry calculations for planets around diverse host stars for PLATO. Top: differences between the individual evening and morning transit depths (transit asymmetries) of cloudy atmosphere scenarios for observation in PLATO’s white band for tidally locked planets with Tglobal = 800 K … 2600 K (left: all latitudes are used, right: only equatorial information is used). Colored stripes indicate the range for cloud scenarios (with cloud mass load, ρg/ρd(z) for atmospheric layers, where 〈a〉 < 0.1 μm is scaled by values between 1 and 10−3) around different main sequence host stars (purple: A, dark blue: F, golden: G, orange: K, gray: M). Circles denote the maximum values and crosses indicate negative evening-morning transit asymmetries for clarity. Bottom: differences for individual evening (thick lines with circle) and morning (thin lines with triangle) transit depths between PLATO’s red and blue filter. The dashed line indicates a transit depth signal of 150 ppm.
Current usage metrics show cumulative count of Article Views (full-text article views including HTML views, PDF and ePub downloads, according to the available data) and Abstracts Views on Vision4Press platform.
Data correspond to usage on the plateform after 2015. The current usage metrics is available 48-96 hours after online publication and is updated daily on week days.
Initial download of the metrics may take a while.