Fig. D.1
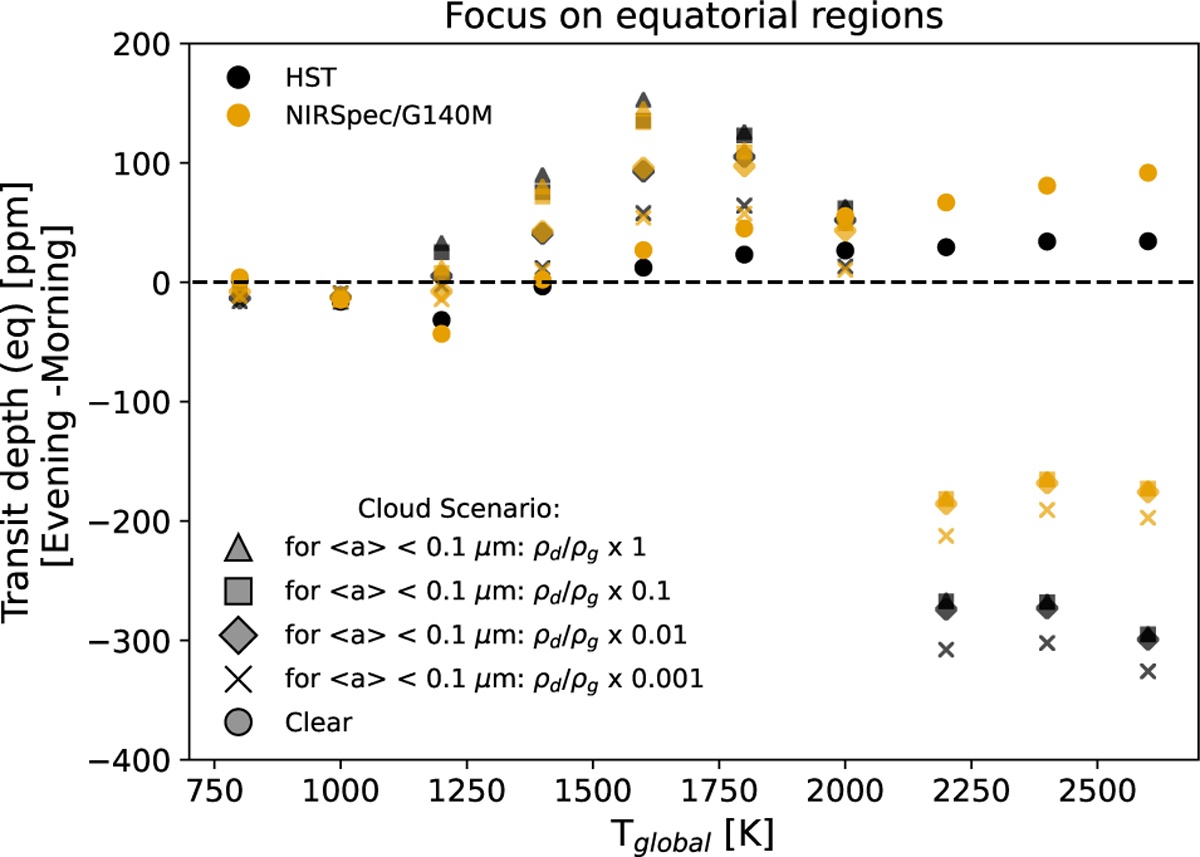
Download original image
Equatorial transit asymmetries from different cloud scenarios in the near infrared. Results are shown for tidally locked planets with Tglobal = 800 K… 2600 K orbiting G main sequence stars. Results for clear atmosphere calculations are indicated by circles. Cloudy scenarios with different cloud mass loads, ρg/ρd(z), in atmospheric layers where 〈a〉 < 0.1 μm are denoted by different markers (crosses: 10−3ρg/ρd(z), diamonds: 10−2ρg/ρd(z), squares: 0.1ρg/ρd(z)). Triangles denote Fefree results with full ρg/ρd(z). Colors denote values integrated in the HST/WFC3IR (black) and NIRSpec/G140M (golden) wavelengths.
Current usage metrics show cumulative count of Article Views (full-text article views including HTML views, PDF and ePub downloads, according to the available data) and Abstracts Views on Vision4Press platform.
Data correspond to usage on the plateform after 2015. The current usage metrics is available 48-96 hours after online publication and is updated daily on week days.
Initial download of the metrics may take a while.