Open Access
Fig. B.3
Download original image
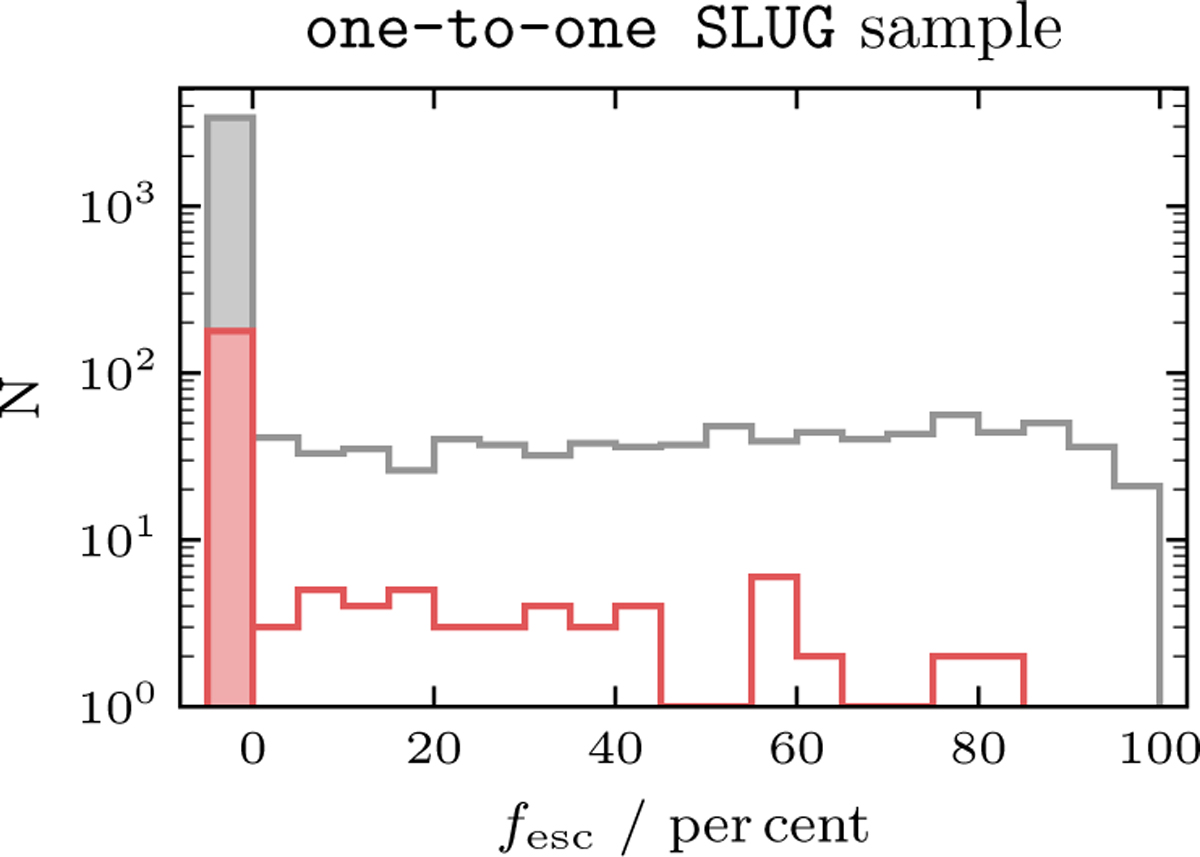
Histograms of the escape fractions based on stellar parameters inferred from SLUG. The full sample is shown in gray and the robust subsample of young and massive, fully contained associations is shown in red. All regions with negative escape fractions are grouped together in the shaded left bar.
Current usage metrics show cumulative count of Article Views (full-text article views including HTML views, PDF and ePub downloads, according to the available data) and Abstracts Views on Vision4Press platform.
Data correspond to usage on the plateform after 2015. The current usage metrics is available 48-96 hours after online publication and is updated daily on week days.
Initial download of the metrics may take a while.