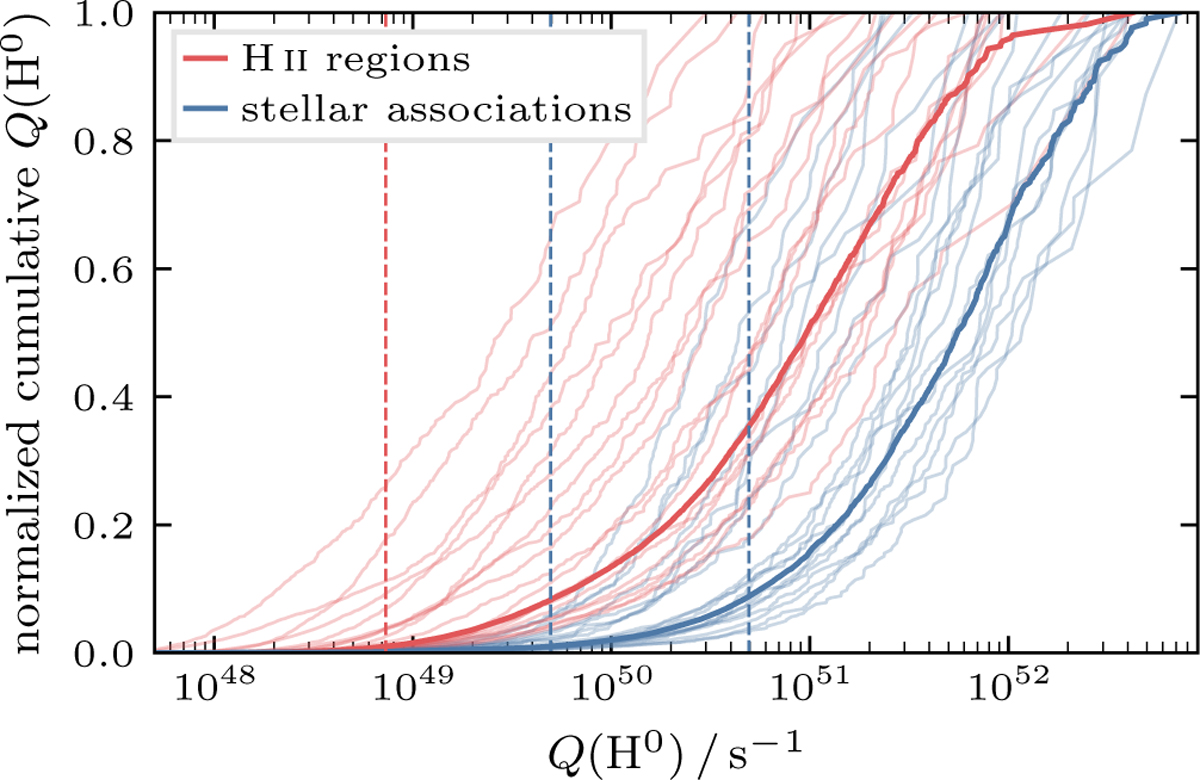
Fig. C.1
Download original image
Normalised cumulative Q(H0) as a function of Q(H0) for H II regions and stellar associations. The individual galaxies are shown in pastel and the sum of all galaxies is shown in bold colours. We only show the H II regions and associations in the overlapping coverage that do not fall in the centre (corresponding to the sample used in Sect. 3.4). The H II region completeness limit from Santoro et al. (2022), corresponding to a luminosity of 1037 erg s−1 is indicated by the left red dashed line. The two blue lines corresponds to a 103 M⊙ and 104 M⊙ cluster that is 1 Myr old.
Current usage metrics show cumulative count of Article Views (full-text article views including HTML views, PDF and ePub downloads, according to the available data) and Abstracts Views on Vision4Press platform.
Data correspond to usage on the plateform after 2015. The current usage metrics is available 48-96 hours after online publication and is updated daily on week days.
Initial download of the metrics may take a while.