Fig. 2
Download original image
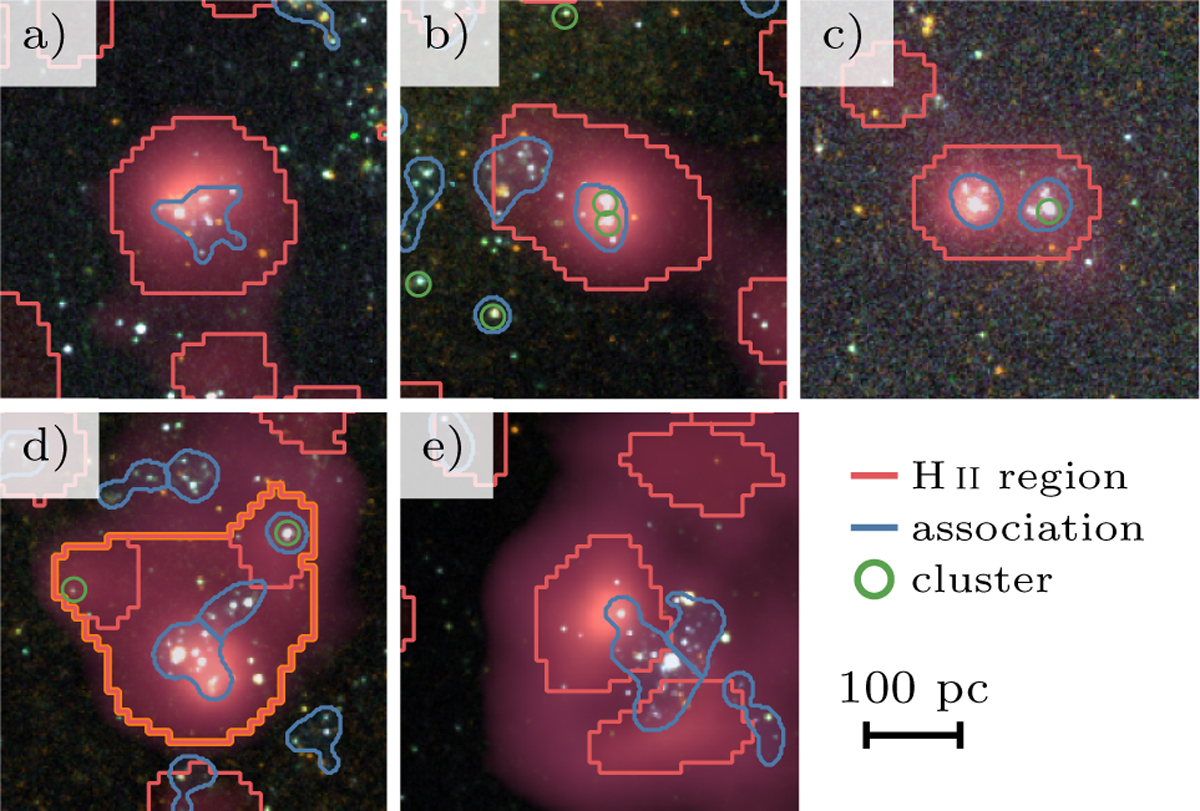
Examples of the overlap between H II regions and their ionising sources. Each cutout shows a three-colour composite image based on the five available HST bands, overlaid with the H α line emission from MUSE in red. (a) H II region with a fully contained association; (b) H II region with fully and partially contained associations plus two compact clusters; (c) H II region with two fully contained associations and one compact cluster; (d) Multiple H II regions that form a single H II region complex with multiple associations and clusters; (e) Association overlapping with two H II regions.
Current usage metrics show cumulative count of Article Views (full-text article views including HTML views, PDF and ePub downloads, according to the available data) and Abstracts Views on Vision4Press platform.
Data correspond to usage on the plateform after 2015. The current usage metrics is available 48-96 hours after online publication and is updated daily on week days.
Initial download of the metrics may take a while.