Fig. 1.
Download original image
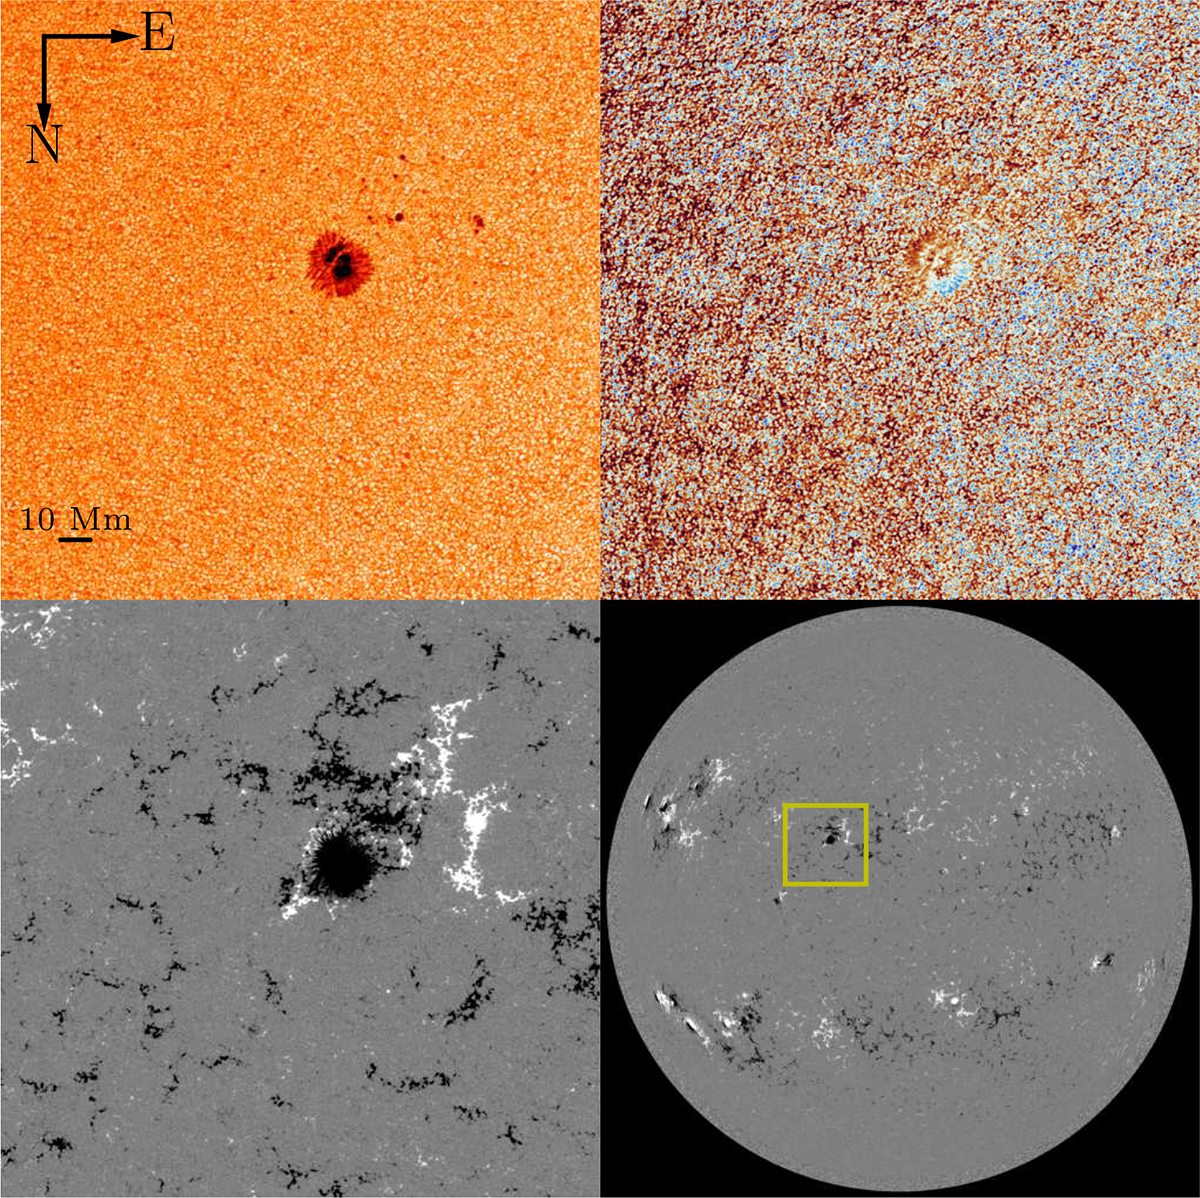
Top left panel: Intensity continuum as measured by SO/PHI-HRT. A 10 Mm scale is given as reference. Top right panel: LoS velocity as measured by SO/PHI-HRT. Bottom left panel: LoS magnetic field as measured by SO/PHI-HRT. Bottom right panel: LoS magnetic field as measured by SDO/HMI. The yellow box shows the SO/PHI-HRT FoV. The black arrows in the top left panel indicate the solar north (N) and east (E). We note that all the panels of this figure are shown in the SDO/HMI detector frame.
Current usage metrics show cumulative count of Article Views (full-text article views including HTML views, PDF and ePub downloads, according to the available data) and Abstracts Views on Vision4Press platform.
Data correspond to usage on the plateform after 2015. The current usage metrics is available 48-96 hours after online publication and is updated daily on week days.
Initial download of the metrics may take a while.