Fig. 2.
Download original image
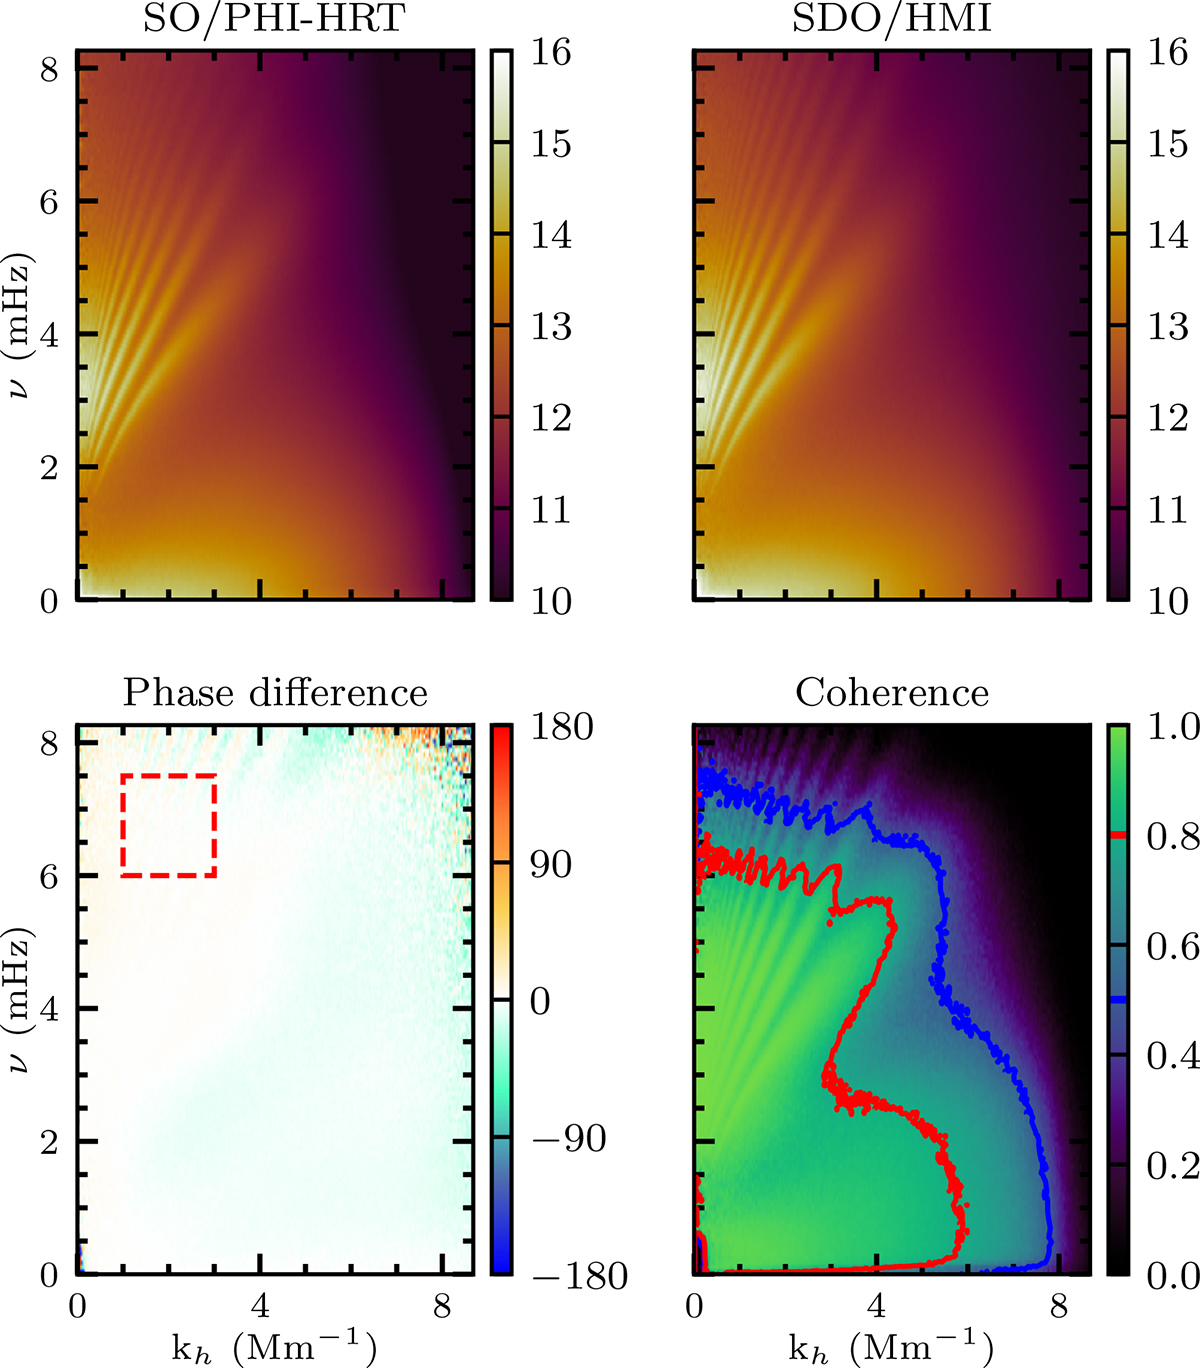
k-ω diagrams. Top left panel: Power spectrum of the remapped SO/PHI-HRT time series (units: m2/s2). Top right panel: Power spectrum of the SDO/HMI time series interpolated to 60 s cadence (units: m2/s2). Bottom left panel: Phase difference between SO/PHI-HRT and SDO/HMI. Positive values mean that SO/PHI-HRT is lagging behind SDO/HMI (units: degrees). The red dashed box shows the area used to compute the height difference between the two signals. Bottom right panel: Coherence spectrum between the two signals. The blue and red contours show the 50% and 80% coherence, respectively.
Current usage metrics show cumulative count of Article Views (full-text article views including HTML views, PDF and ePub downloads, according to the available data) and Abstracts Views on Vision4Press platform.
Data correspond to usage on the plateform after 2015. The current usage metrics is available 48-96 hours after online publication and is updated daily on week days.
Initial download of the metrics may take a while.