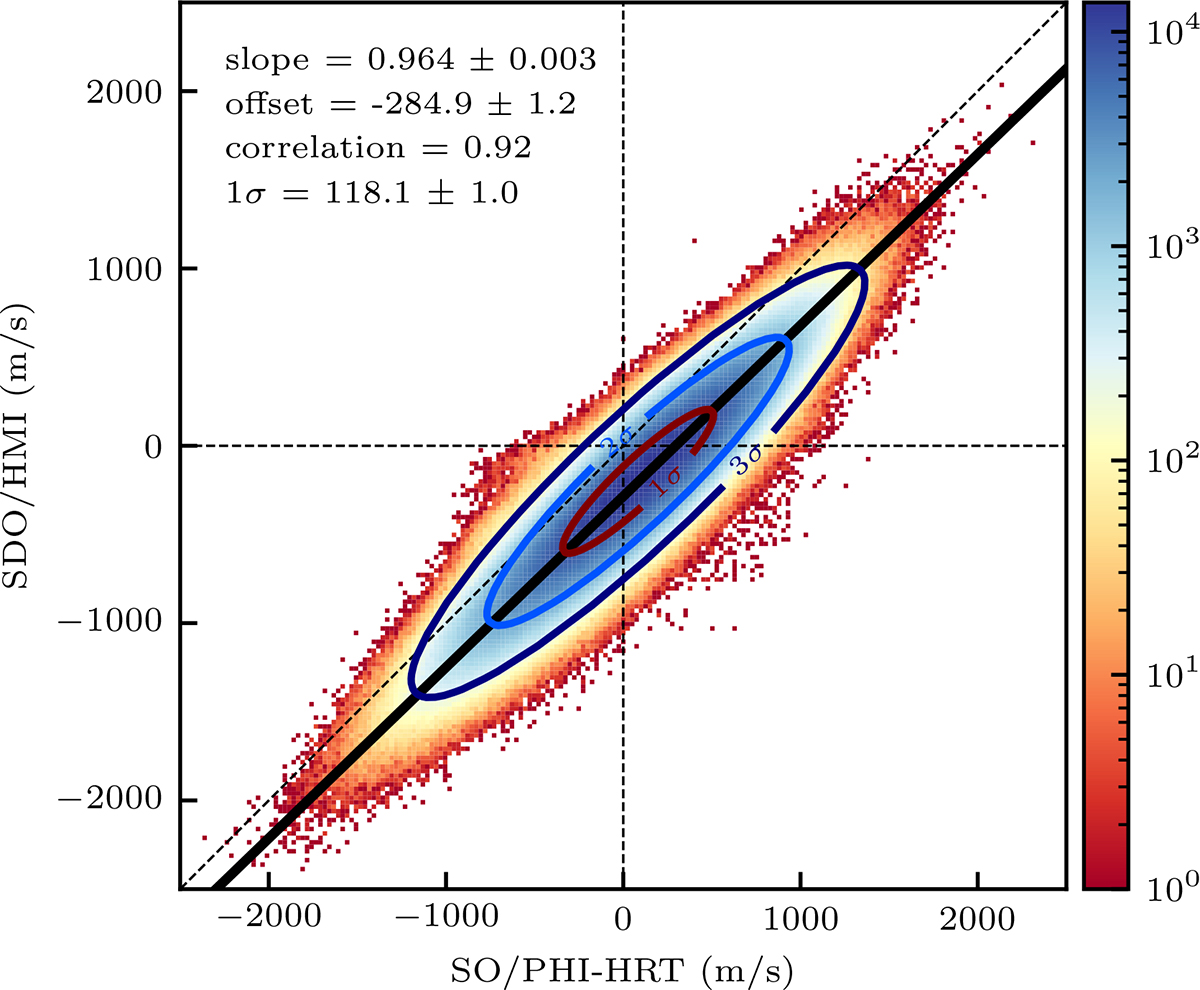
Fig. 3.
Download original image
Scatter plot distribution of the velocity field values as measured by the remapped SO/PHI-HRT (x-axis) and SDO/HMI (y-axis). The color scale shows the number of points in each bin on a logarithmic scale. The black line shows an orthogonal least-squares linear fit to the data points, while the contours depict the results of a 2D Gaussian distribution fit. The slope and offset obtained by the linear fit, the Pearson correlation coefficient, and the 1σ spread of the Gaussian fit are indicated in the top left corner of the figure. The uncertainties represent one standard deviation estimated using the bootstrap method with 500 subsamples.
Current usage metrics show cumulative count of Article Views (full-text article views including HTML views, PDF and ePub downloads, according to the available data) and Abstracts Views on Vision4Press platform.
Data correspond to usage on the plateform after 2015. The current usage metrics is available 48-96 hours after online publication and is updated daily on week days.
Initial download of the metrics may take a while.