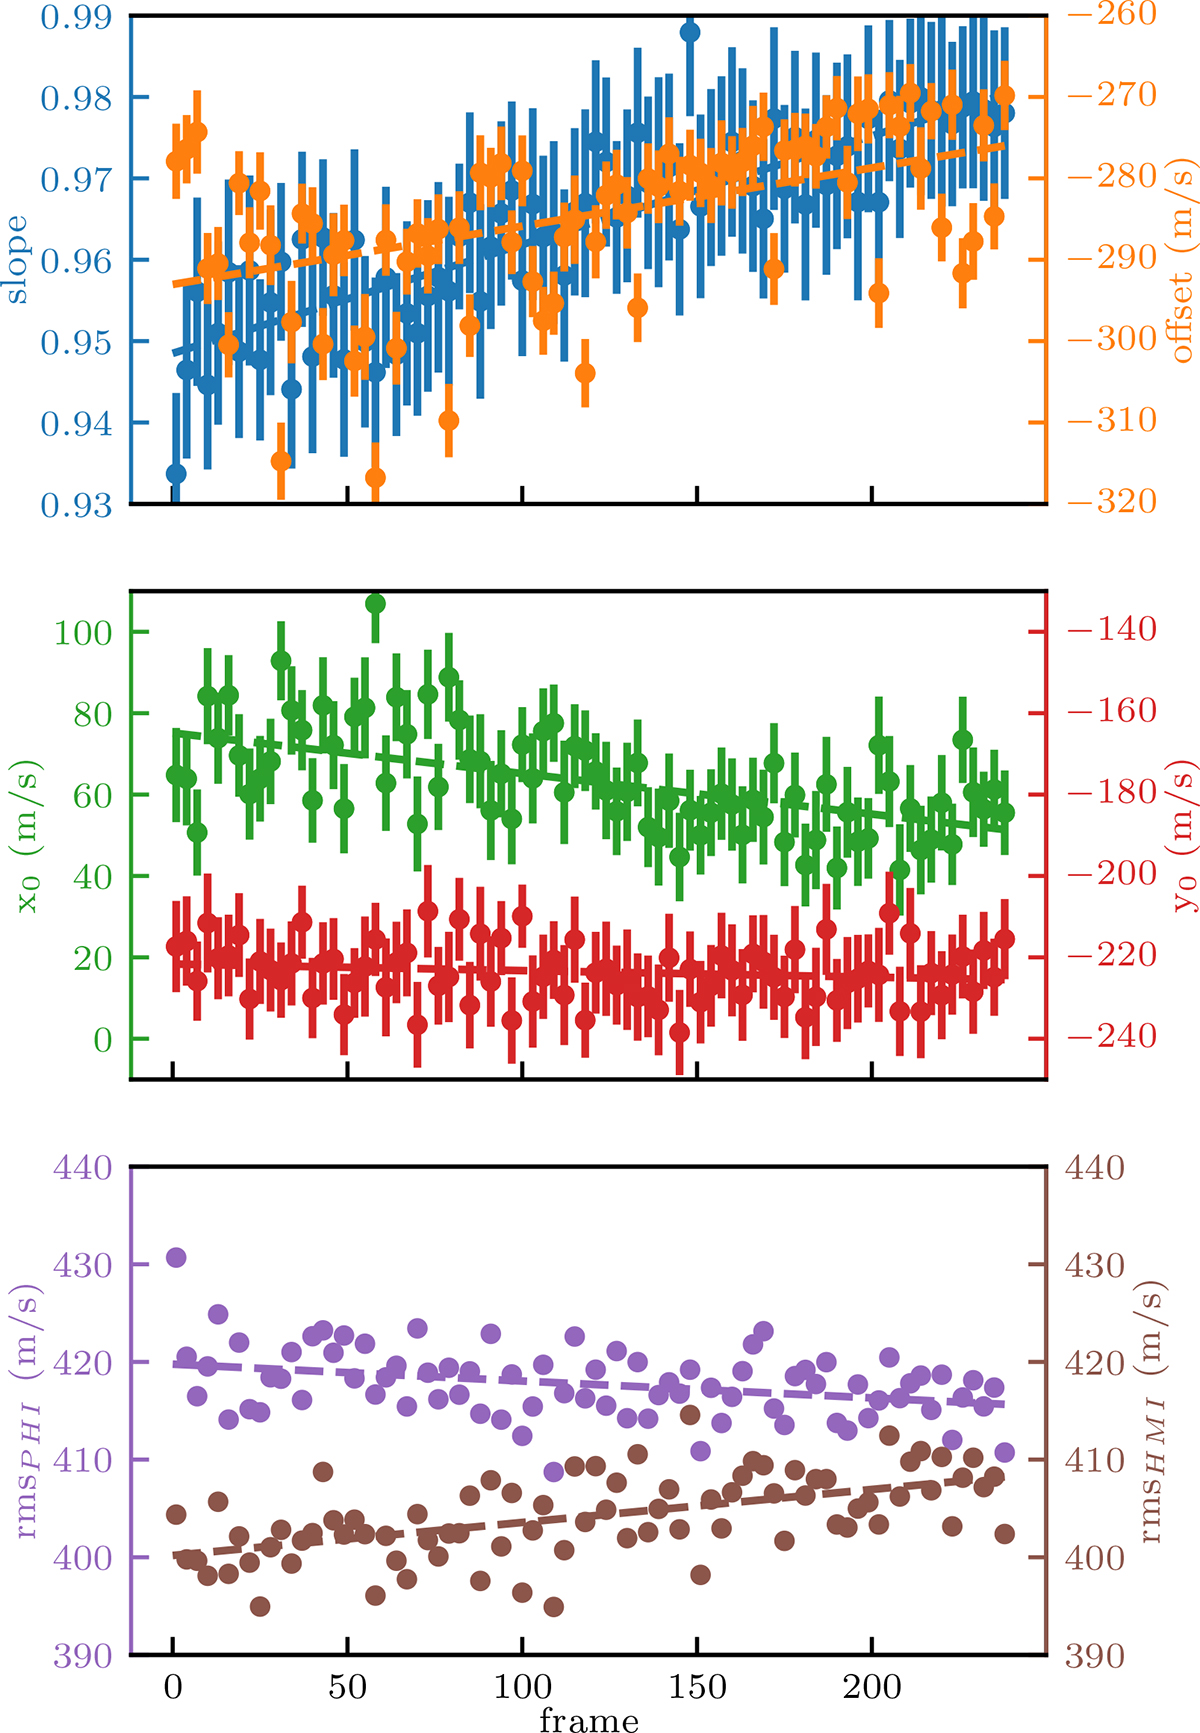
Fig. 4.
Download original image
Temporal variation of the fitting results. The dots represent the results of the fits obtained frame by frame, whereas the dashed lines show the linear trends of these results. The error bars represent one standard deviation estimated using the bootstrap method with 80 subsamples used for the fitting. Top panel: Slope (left axis, blue) and offset (right axis, orange) obtained by the linear fit. Middle panel: x (left axis, green) and y (right axis, red) coordinates of the mean of the 2D Gaussian distribution. Bottom panel: Root mean square (rms) of the remapped SO/PHI-HRT (left axis, purple) and of the SDO/HMI (right axis, brown) time series.
Current usage metrics show cumulative count of Article Views (full-text article views including HTML views, PDF and ePub downloads, according to the available data) and Abstracts Views on Vision4Press platform.
Data correspond to usage on the plateform after 2015. The current usage metrics is available 48-96 hours after online publication and is updated daily on week days.
Initial download of the metrics may take a while.