Fig. 5.
Download original image
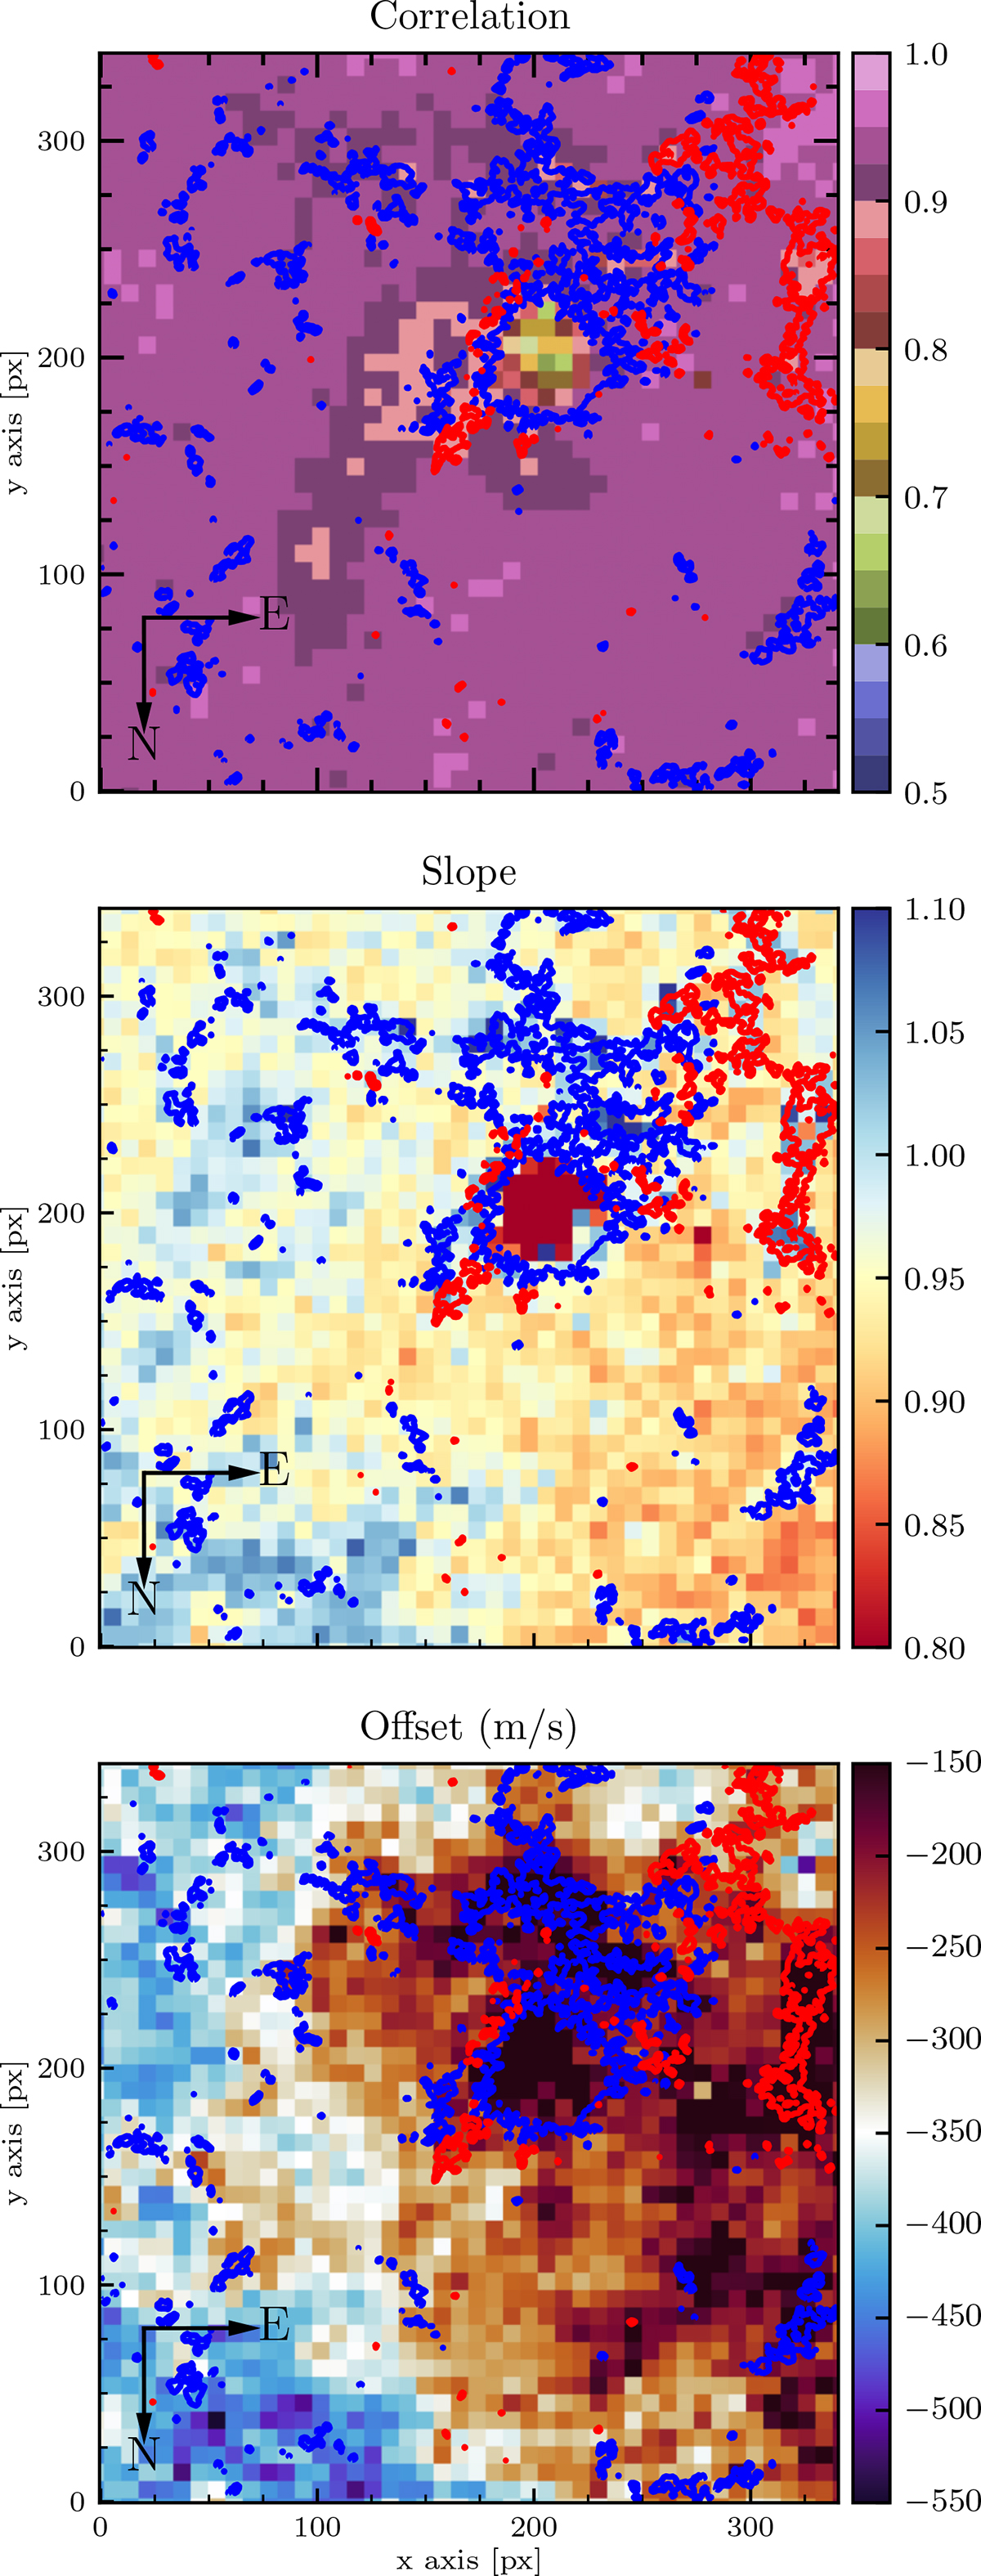
Spatial dependence of the temporal correlation between the remapped SO/PHI-HRT and SDO/HMI signals (top panel), and of the slope (middle panel) and offset (bottom panel) obtained by the linear fit. The blue and red contours show the −200 and +200 G values of the SO/PHI-HRT LoS magnetic field, respectively. The FoV is shown as a yellow box in Fig. 1. The black arrows in each panel indicate the north (N) and east (E) solar limb as in Fig. 1.
Current usage metrics show cumulative count of Article Views (full-text article views including HTML views, PDF and ePub downloads, according to the available data) and Abstracts Views on Vision4Press platform.
Data correspond to usage on the plateform after 2015. The current usage metrics is available 48-96 hours after online publication and is updated daily on week days.
Initial download of the metrics may take a while.