Fig. 6.
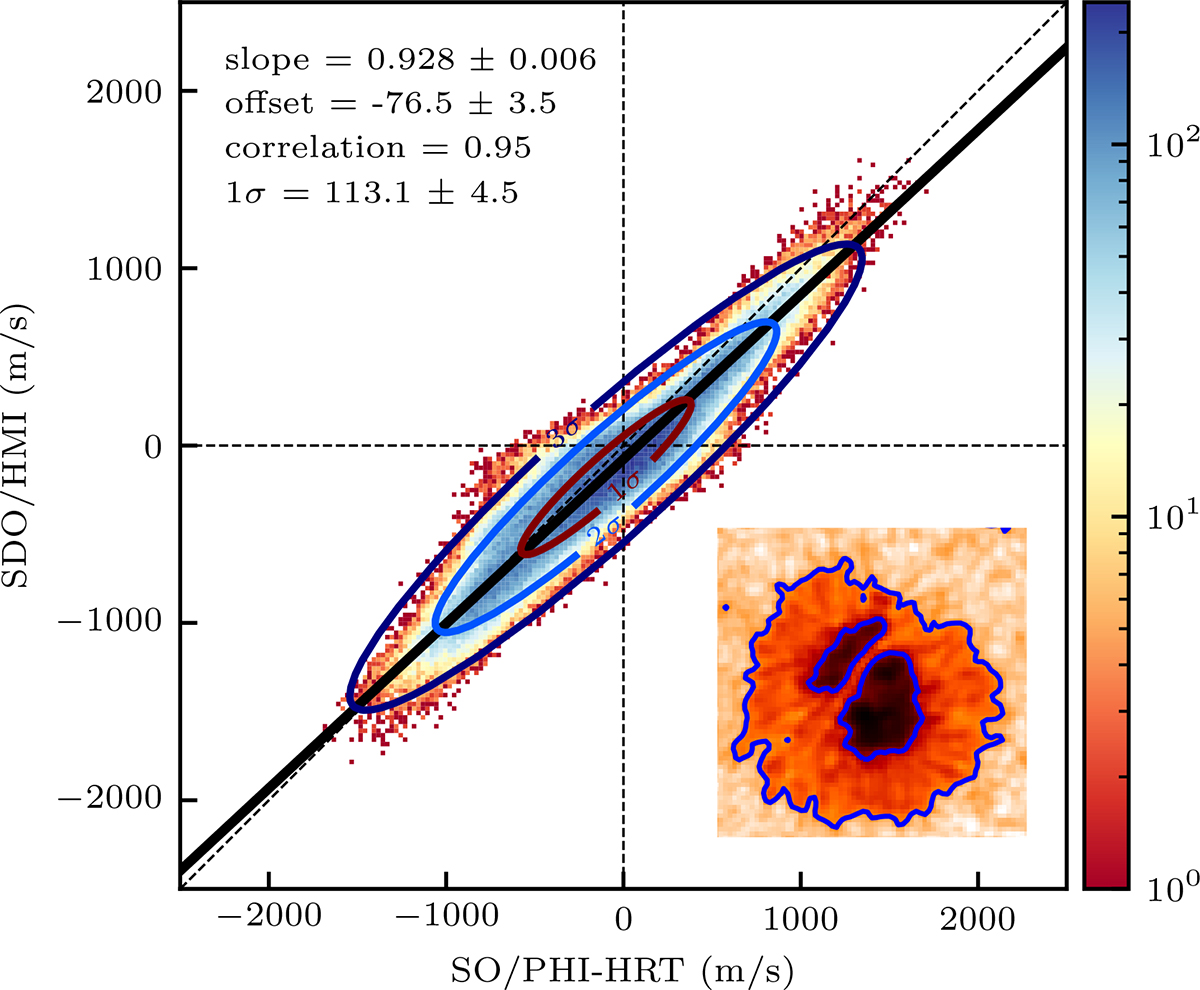
Download original image
Scatter plot distribution of the velocity field values as measured by the remapped SO/PHI-HRT (x-axis) and SDO/HMI (y-axis) in the sunspot penumbra. The colors and lines are defined as in Fig. 3. The uncertainties represent one standard deviation estimated using the bootstrap method with 100 subsamples. The image in the lower right quadrant shows a snapshot of the sunspot observed by SDO/HMI oriented as in Fig. 1, and the blue contours define the penumbra boundaries.
Current usage metrics show cumulative count of Article Views (full-text article views including HTML views, PDF and ePub downloads, according to the available data) and Abstracts Views on Vision4Press platform.
Data correspond to usage on the plateform after 2015. The current usage metrics is available 48-96 hours after online publication and is updated daily on week days.
Initial download of the metrics may take a while.