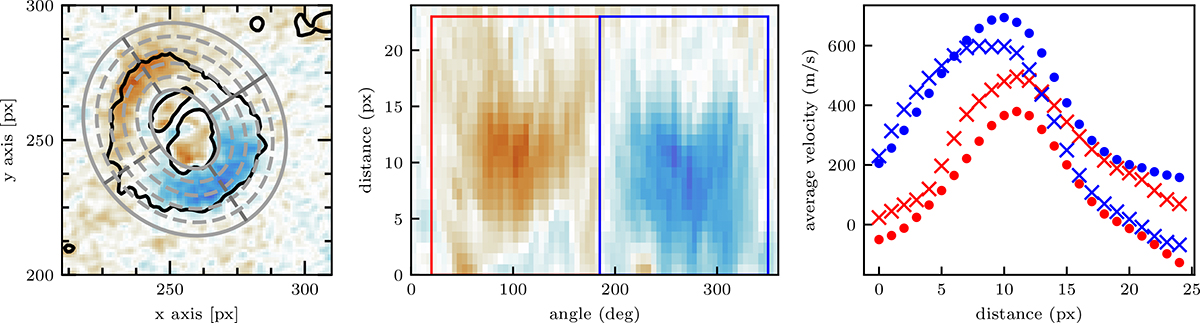
Fig. 7.
Download original image
Left panel: Remapped SO/PHI-HRT LoS velocity signal around the sunspot averaged in time (oriented as in Fig. 1). The black contours are at 55% and 89% of the average continuum intensity. The gray lines show the grid used for the elliptical polar projection of the penumbra. The solid gray ellipses are the starting and ending points of the radial distance axis; the solid straight gray line shows the starting point of the azimuth angle axis (measured counterclockwise). Middle panel: Same signal as shown in the left panel, but represented on the elliptical polar grid displayed in the left panel. The x-axis shows the azimuth; the y-axis shows the radial distance (in pixel) from the innermost ellipse. Right panel: Azimuthal average of the signal within the blue and red boxes of the middle panel. The crosses show the remapped SO/PHI-HRT signal, whereas the points are the SDO/HMI signal. The colors correspond to the boxes shown in the middle panel. The values displayed in blue are multiplied by -1 for easier comparison.
Current usage metrics show cumulative count of Article Views (full-text article views including HTML views, PDF and ePub downloads, according to the available data) and Abstracts Views on Vision4Press platform.
Data correspond to usage on the plateform after 2015. The current usage metrics is available 48-96 hours after online publication and is updated daily on week days.
Initial download of the metrics may take a while.