Fig. A.1.
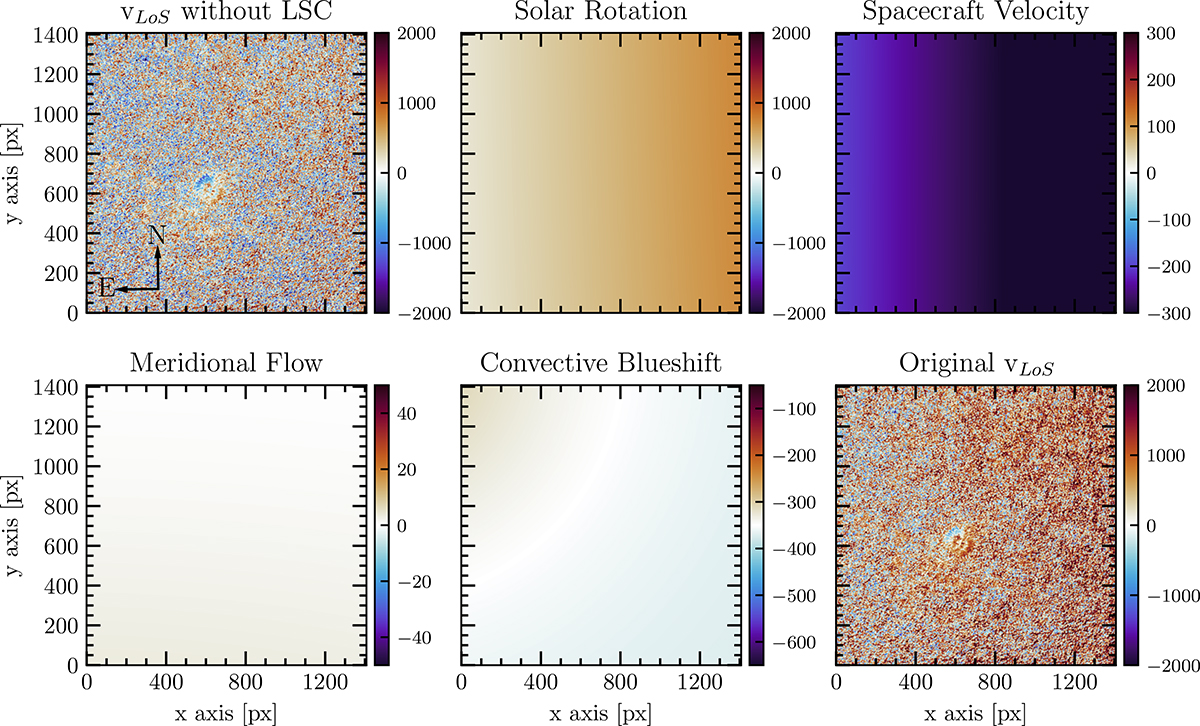
Download original image
Top left panel: SO/PHI-HRT Dopplergram after the removal of the LSCs. The black arrows indicate the north (N) and east (E) solar limb, as in the SO/PHI-HRT detector frame. Top middle panel: Differential solar rotation contribution. Top right panel: Spacecraft velocity residuals. Bottom left panel: Meridional flow contribution. Bottom middle panel: Convective blueshift signal. Bottom right panel: Original SO/PHI-HRT Dopplergram. The units are in m/s in every plot.
Current usage metrics show cumulative count of Article Views (full-text article views including HTML views, PDF and ePub downloads, according to the available data) and Abstracts Views on Vision4Press platform.
Data correspond to usage on the plateform after 2015. The current usage metrics is available 48-96 hours after online publication and is updated daily on week days.
Initial download of the metrics may take a while.