Fig. 10.
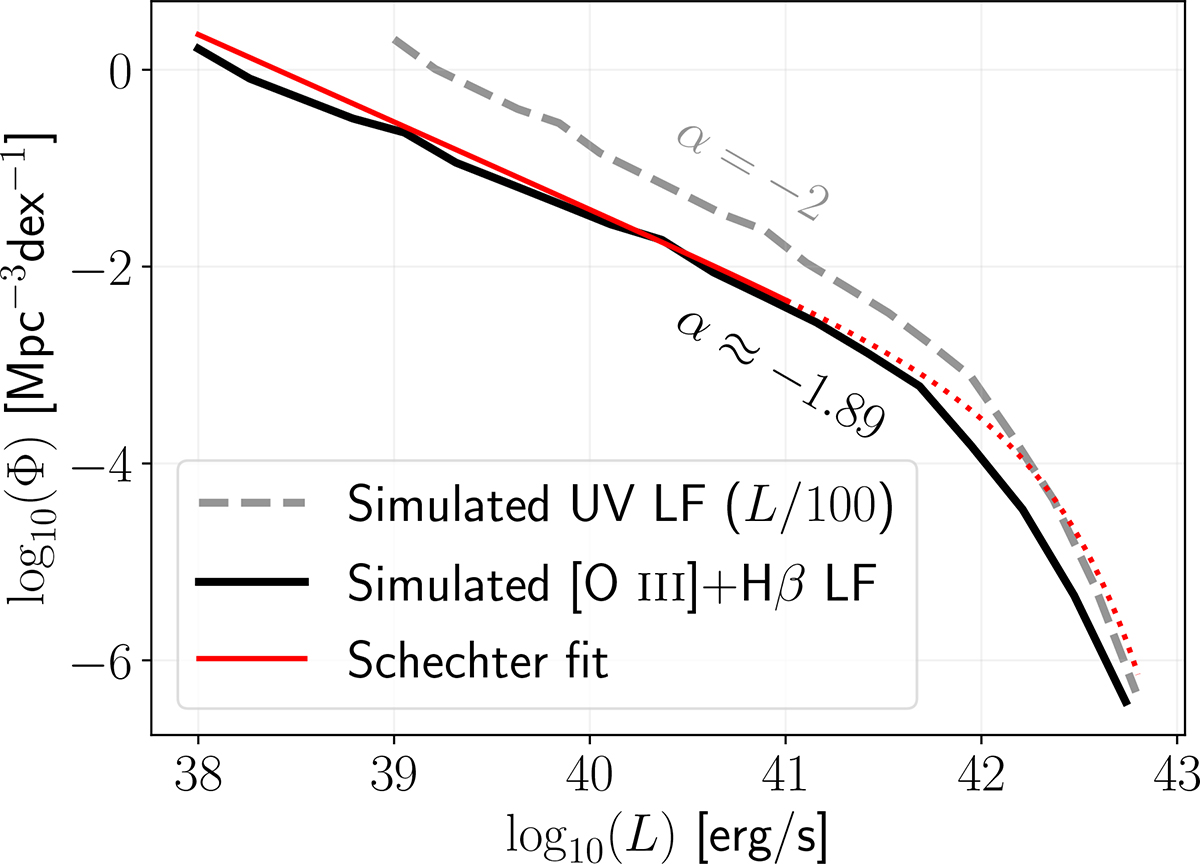
Download original image
Demonstration of the effects that arise from allowing the nebular emission lines to be fainter than the continuum in the faintest sources. This enables us to flatten an intrinsically steep UV LF (α ∼ −2, in grey) into a flatter nebular emission line LF (α ∼ −1.89, in black). In red is the Schechter least square fit (α = −1.89, log10L* = 42.09, log10ϕ* = −3.63) of the simulated [O III]+Hβ LF. The bright end is dashed, as the effect applied yields non-Schechter-like profile on the bright end.
Current usage metrics show cumulative count of Article Views (full-text article views including HTML views, PDF and ePub downloads, according to the available data) and Abstracts Views on Vision4Press platform.
Data correspond to usage on the plateform after 2015. The current usage metrics is available 48-96 hours after online publication and is updated daily on week days.
Initial download of the metrics may take a while.