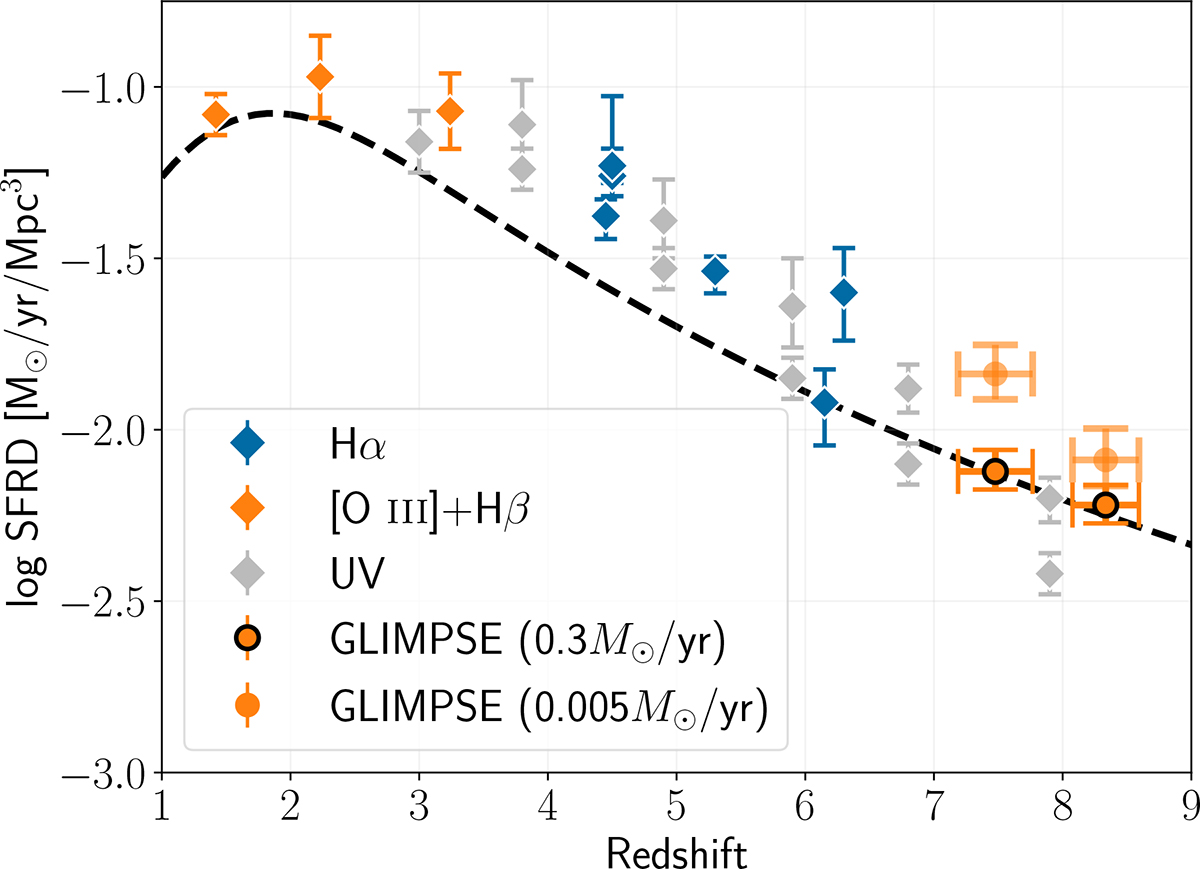
Fig. 13.
Download original image
Evolution over redshift of the star formation rate density. We used the same colour scheme as Fig. 8, where grey corresponds to measurements based on UV, blue to Hα and orange to [O III] and [O III]+Hβ. The black line corresponds to the results of the review Madau & Dickinson (2014), which compiles the state-of-the-art measurements of the time. All the results have an integration lower limit of 0.24 − 0.30 M⊙ yr−1 Mpc−3 and are IMF-corrected to Chabrier (2003). The z ∼ 7 − 9 orange points correspond to GLIMPSE measurements, where the bright orange uses the standard 0.3 M⊙ yr−1 Mpc−3 lower integration limit and the light orange uses the deep 0.005 M⊙ yr−1 lower integration limit (approximately corresponding to LHα ∼ 1039 erg s−1). The non-exhaustive compilation of UV, Hα and [O III]+Hβ based measurements, including this work, are listed in Table E.1.
Current usage metrics show cumulative count of Article Views (full-text article views including HTML views, PDF and ePub downloads, according to the available data) and Abstracts Views on Vision4Press platform.
Data correspond to usage on the plateform after 2015. The current usage metrics is available 48-96 hours after online publication and is updated daily on week days.
Initial download of the metrics may take a while.