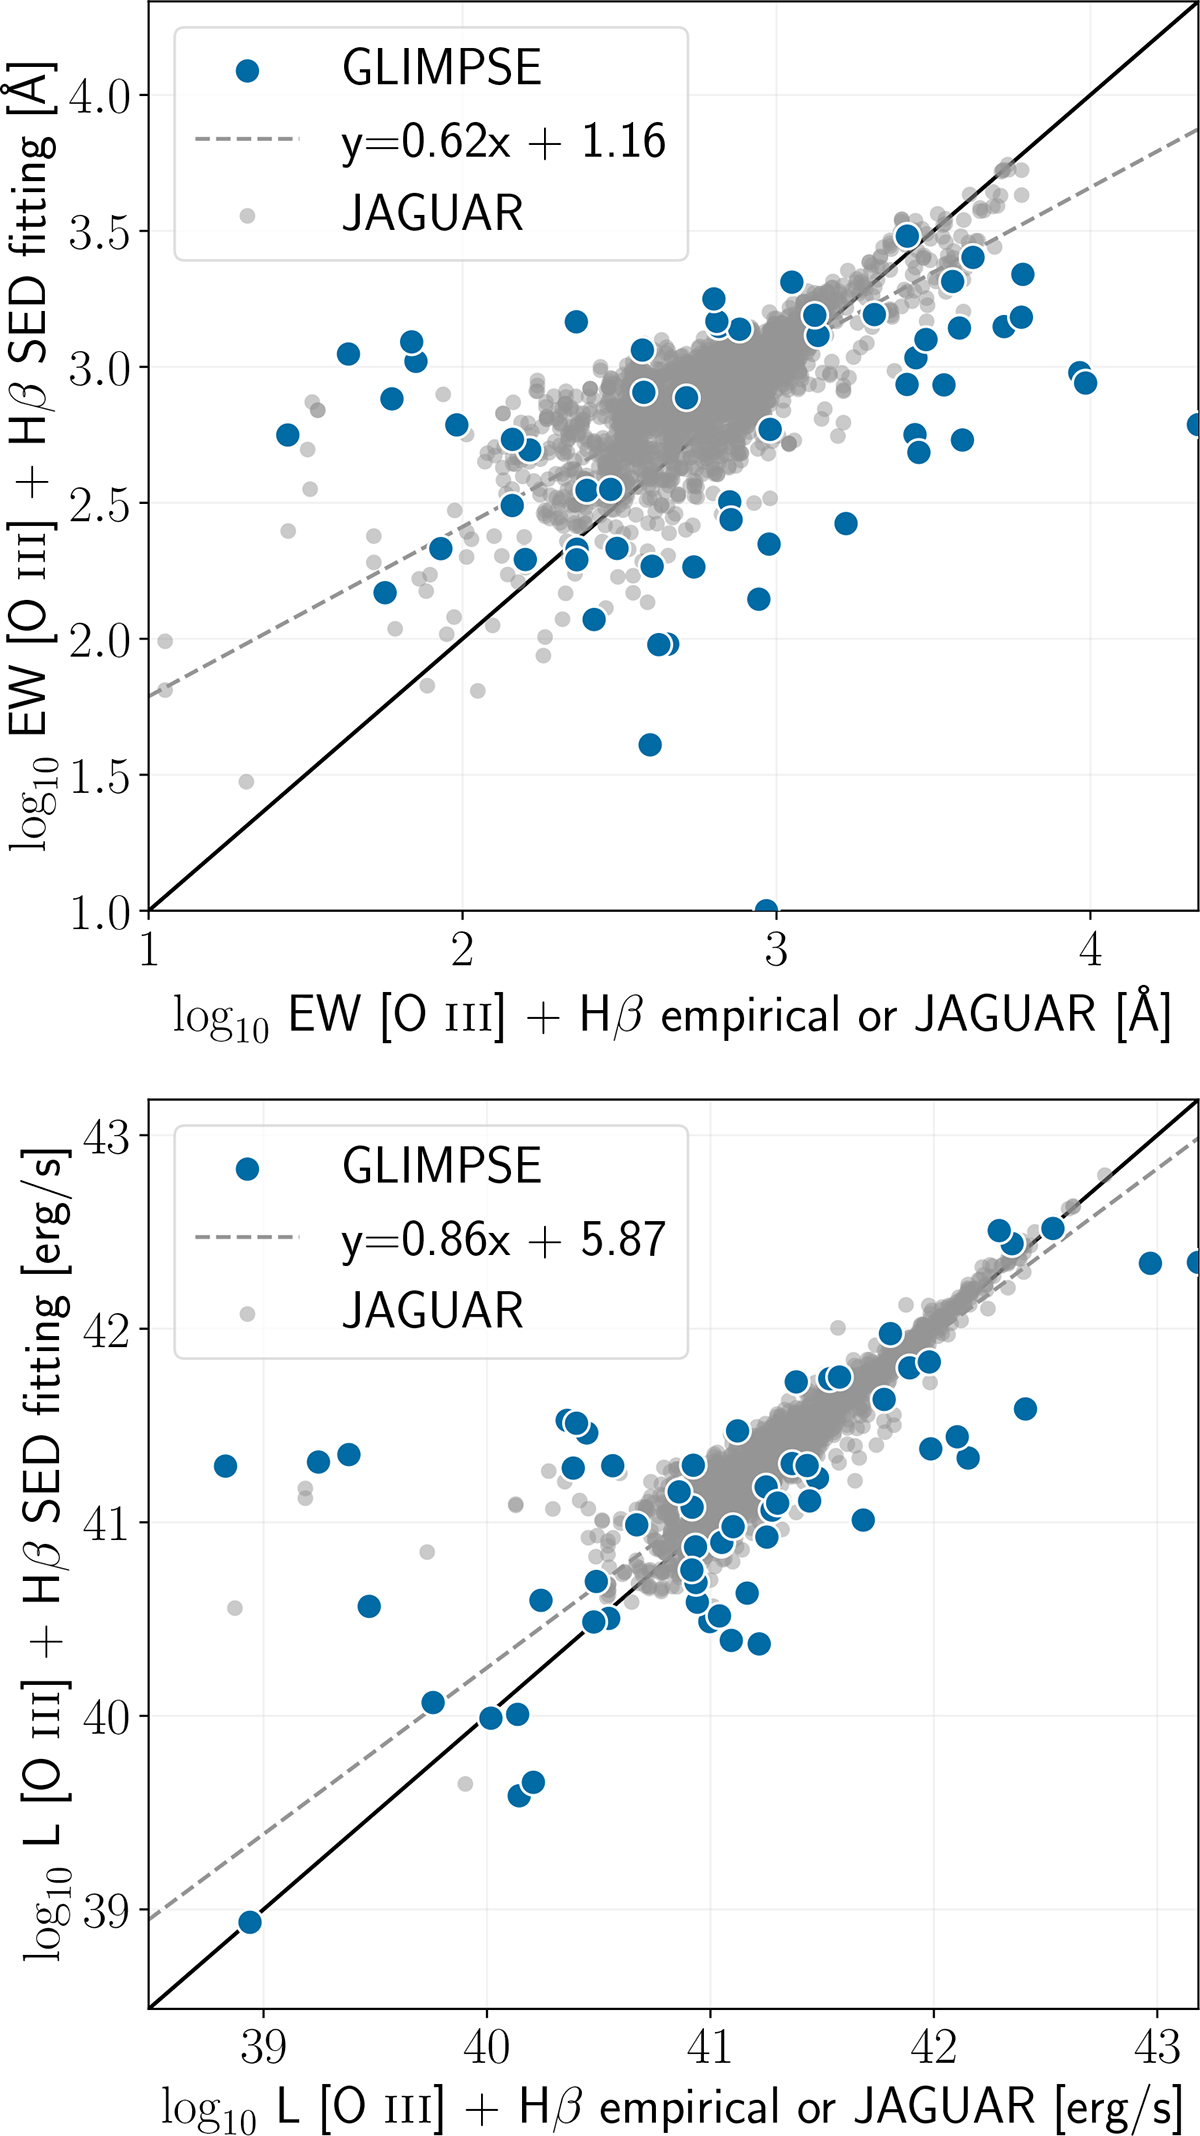
Fig. A.1.
Download original image
Comparison of measurement of the equivalent width and line flux of [O III]+Hβ using SED fitting (CIGALE) against the empirical method (blue dots) and the JAGUAR simulations (grey dots). Only sources with a valid empirical measurement were kept. For JAGUAR, we kept sources with redshift measurements within 1σ to ensure a fairer comparison with GLIMPSE. We did not display uncertainties for readability reasons. For the JAGUAR simulation, we added a linear fit on the equivalent widths and line fluxes (dashed grey lines).
Current usage metrics show cumulative count of Article Views (full-text article views including HTML views, PDF and ePub downloads, according to the available data) and Abstracts Views on Vision4Press platform.
Data correspond to usage on the plateform after 2015. The current usage metrics is available 48-96 hours after online publication and is updated daily on week days.
Initial download of the metrics may take a while.