Fig. 9.
Download original image
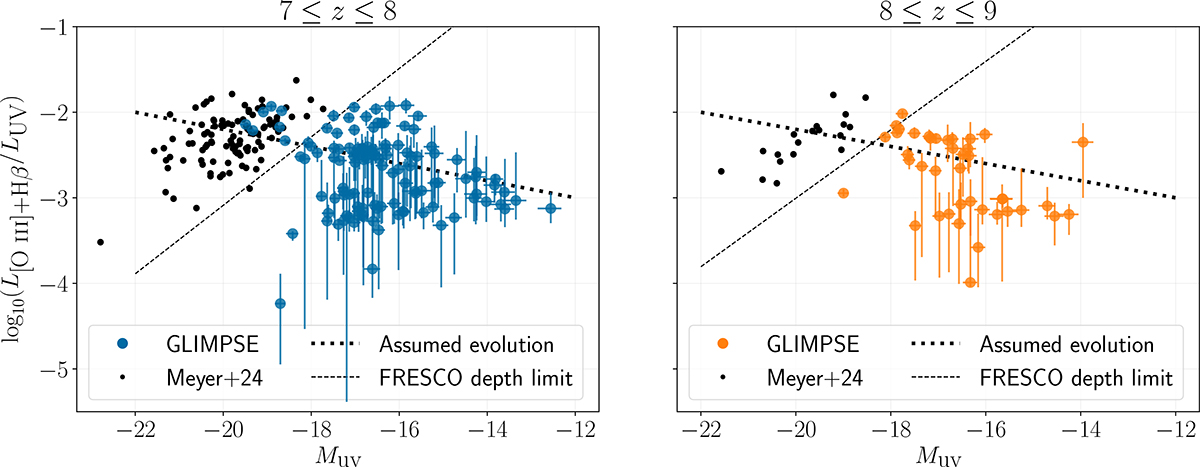
Evolution of the [O III]+Hβ-to-UV ratio with MUV for the 7 < z < 8 sample (left panel) and the 8 < z < 9 sample (right panel). In black is the FRESCO data from Meyer et al. (2024) with depth limit in dashed line, to cover the bright end. The dotted line shows the assumed evolution of the ratio following R = −0.1 × MUV − 4.2, which enables us to flatten an nebular emission line LF from an intrinsically steep LF, as shown in Fig. 10. This law is arbitrary and chosen to follow the data in a simple manner. However, it does follow closely the linear fit of the data.
Current usage metrics show cumulative count of Article Views (full-text article views including HTML views, PDF and ePub downloads, according to the available data) and Abstracts Views on Vision4Press platform.
Data correspond to usage on the plateform after 2015. The current usage metrics is available 48-96 hours after online publication and is updated daily on week days.
Initial download of the metrics may take a while.