Fig. 1.
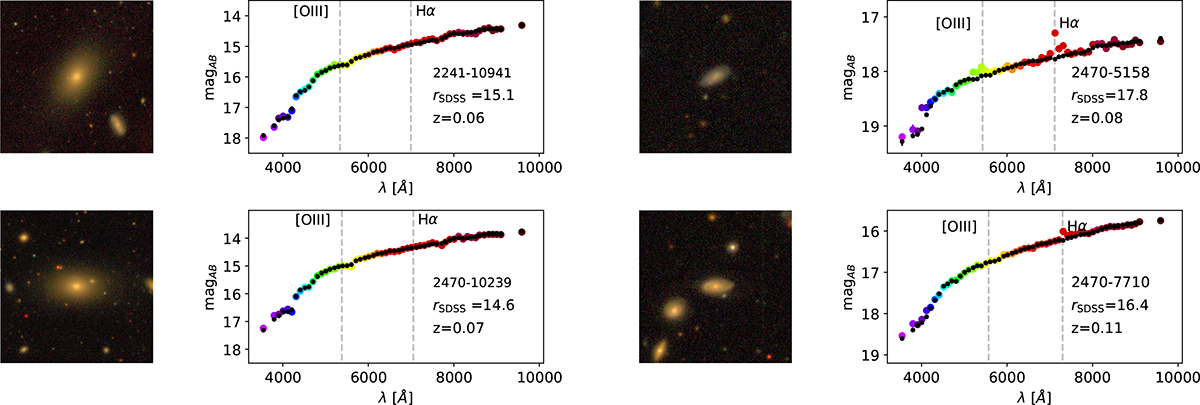
Download original image
Example of galaxies in sample and their J-spectra. Left panels show the RGB images of two red galaxies. The second column shows the MAG_AUTO J-spectra of the red galaxies. The third column shows the RGB images of two blue galaxies. Right panels show the MAG_AUTO J-spectra of blue galaxies. Colour points represent the observed magnitudes. Black dots represent the result of the SED fitting. The dashed grey lines represent the wavelengths at which [OIII] and Hα are found. Galaxy spectra are shown in the observer frame, and they correspond to the galaxy in the centre of the image. The redshifts shown correspond to the most likely value (PHOTOZ) of the redshift probability density function (zPDF; see Hernán-Caballero et al. 2021).
Current usage metrics show cumulative count of Article Views (full-text article views including HTML views, PDF and ePub downloads, according to the available data) and Abstracts Views on Vision4Press platform.
Data correspond to usage on the plateform after 2015. The current usage metrics is available 48-96 hours after online publication and is updated daily on week days.
Initial download of the metrics may take a while.