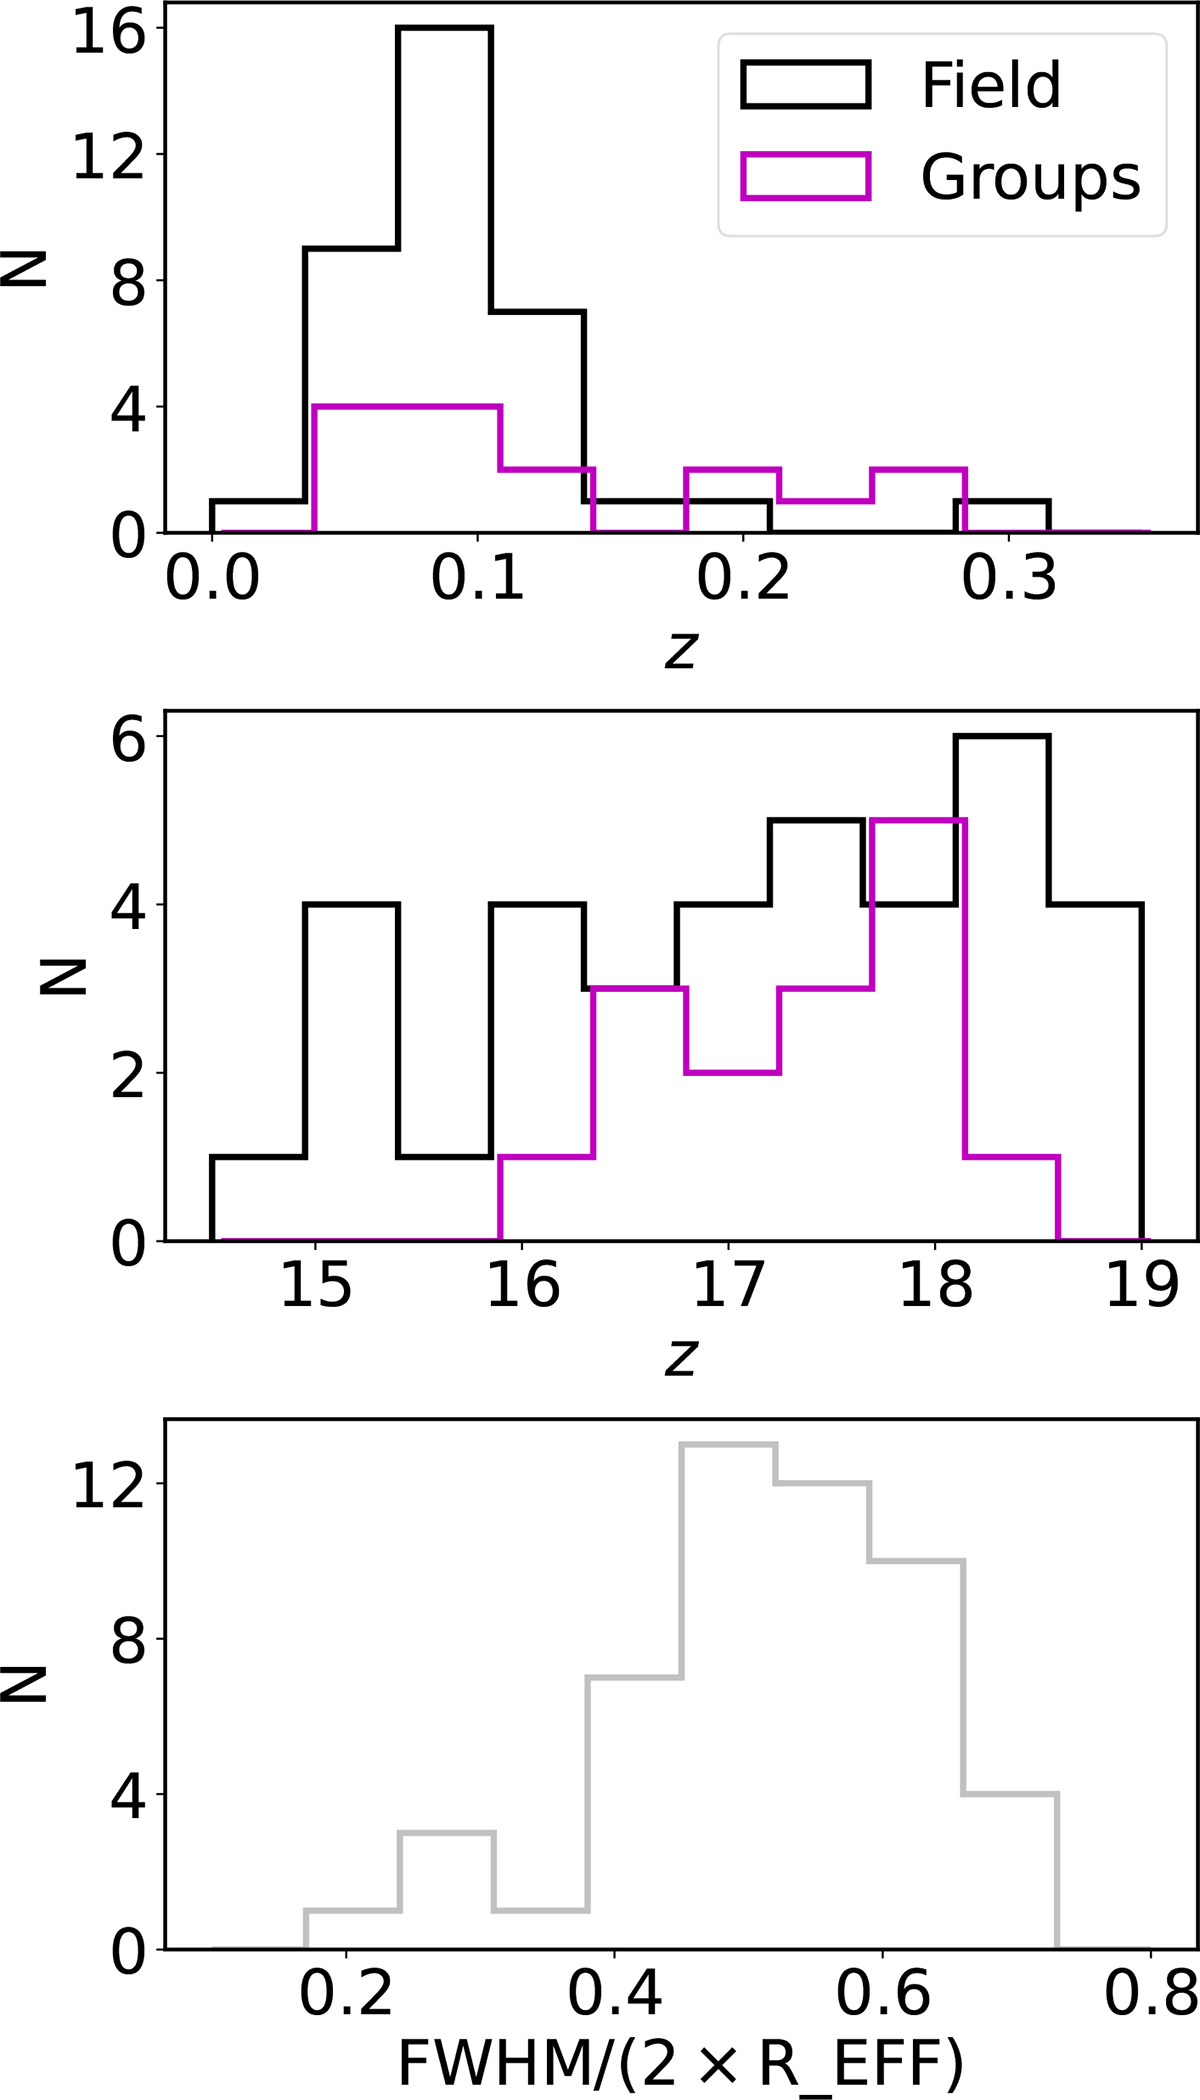
Fig. A.1.
Download original image
Integrated observational properties of the spatially resolved galaxies in this work. First panel shows the histogram of the redshift of the galaxies. Middle panel shows the distribution of the magnitude in the rSDSS of the MAG_AUTO photometry. Black histograms represent galaxies in the field, and magenta histograms represent galaxies in groups. Last panel shows the comparison of the FWHM of the worst PSF for each galaxy and the double of its effective radius for the complete sample.
Current usage metrics show cumulative count of Article Views (full-text article views including HTML views, PDF and ePub downloads, according to the available data) and Abstracts Views on Vision4Press platform.
Data correspond to usage on the plateform after 2015. The current usage metrics is available 48-96 hours after online publication and is updated daily on week days.
Initial download of the metrics may take a while.