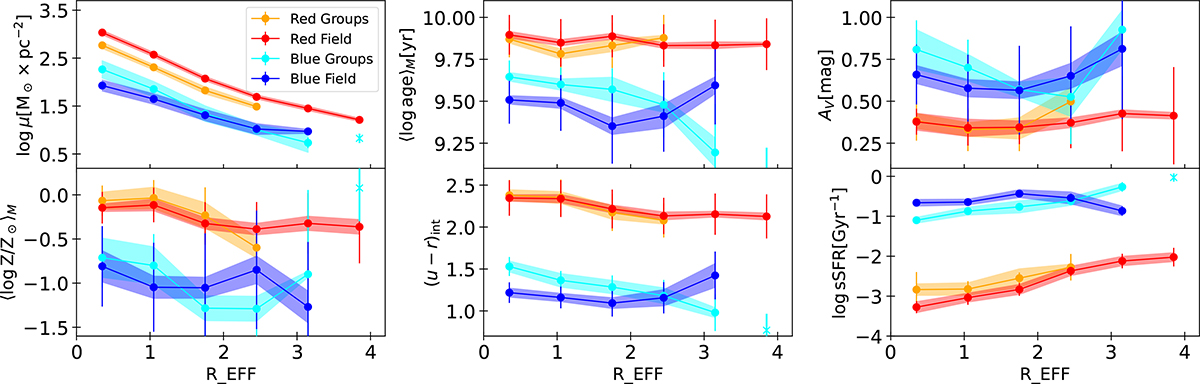
Fig. 5.
Download original image
Radial profile and gradients of stellar mass surface density by galaxy colour and environment. Colour-coding is the same as in Fig. 3. The dashed lines represent the median value in the radius bin. Each colour shade represents the error of the median. Error bars represent the typical error in each bin. Single points represent bins where only one region was left after the S/N cleaning.
Current usage metrics show cumulative count of Article Views (full-text article views including HTML views, PDF and ePub downloads, according to the available data) and Abstracts Views on Vision4Press platform.
Data correspond to usage on the plateform after 2015. The current usage metrics is available 48-96 hours after online publication and is updated daily on week days.
Initial download of the metrics may take a while.