Open Access
Fig. 8.
Download original image
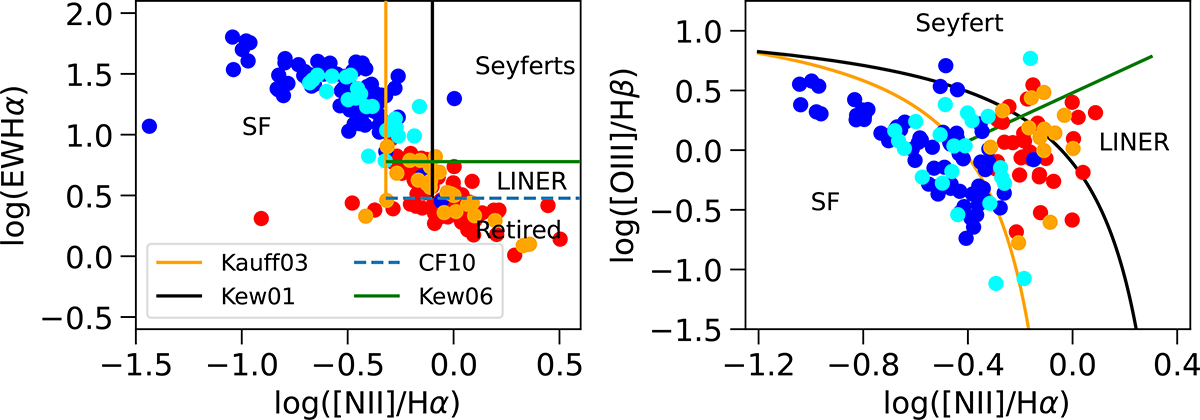
WHAN (left panel) and BPT (right panel) diagrams of regions of spatially resolved galaxies in miniJPAS. Red points represent red galaxies in the field. Orange points represent red galaxies in groups. Blue points represent blue galaxies in the field. Cyan points represent blue galaxies in groups.
Current usage metrics show cumulative count of Article Views (full-text article views including HTML views, PDF and ePub downloads, according to the available data) and Abstracts Views on Vision4Press platform.
Data correspond to usage on the plateform after 2015. The current usage metrics is available 48-96 hours after online publication and is updated daily on week days.
Initial download of the metrics may take a while.