Fig. 9.
Download original image
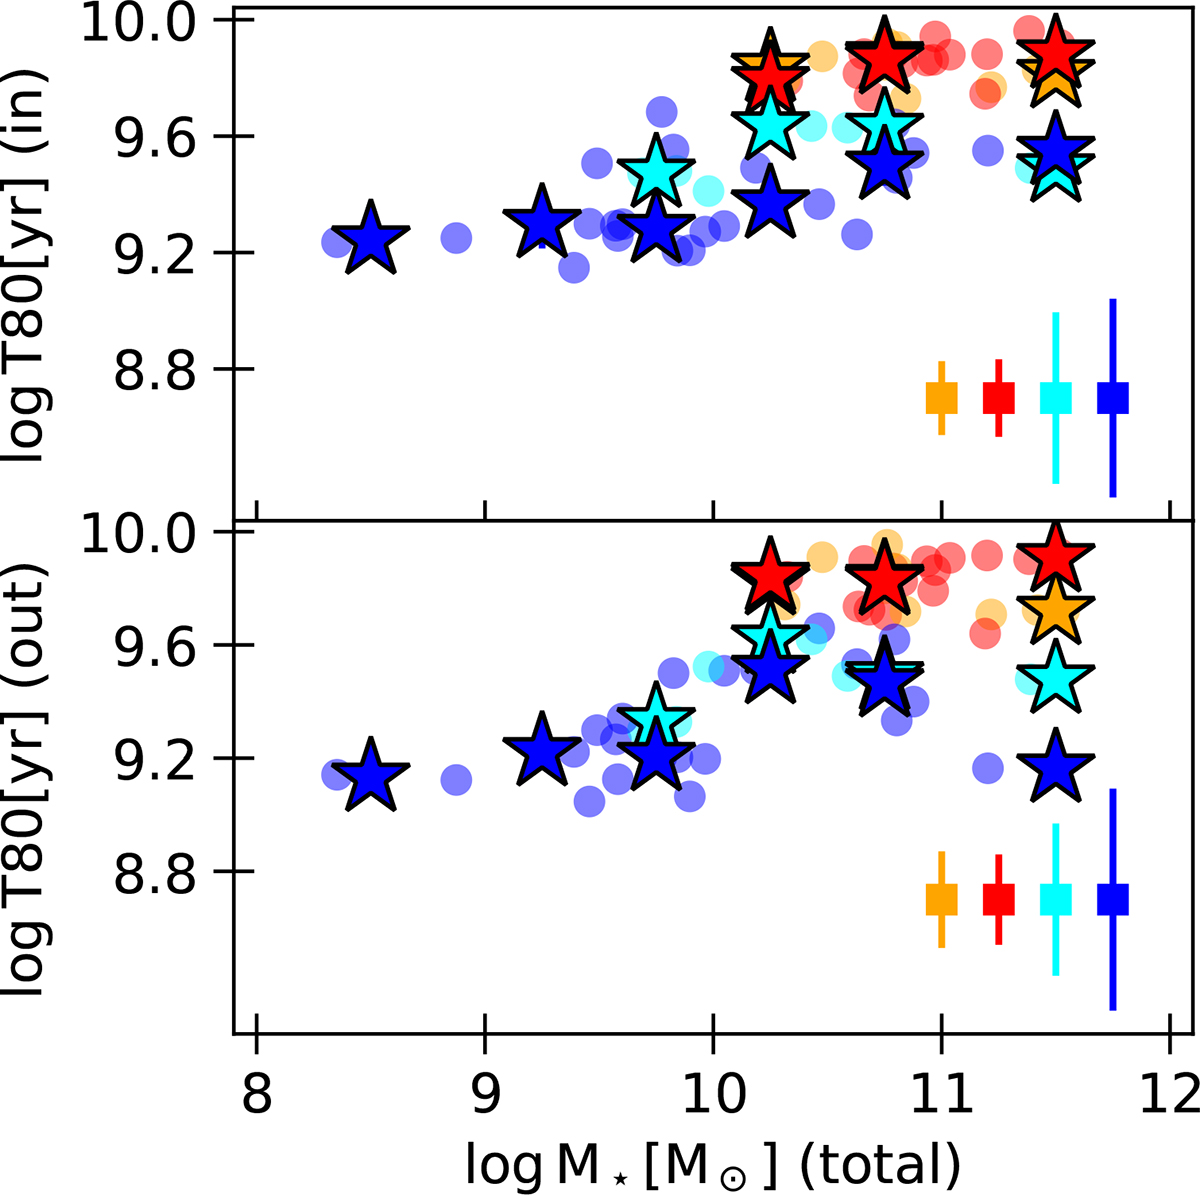
T80 versus galaxy total mass. The upper panel shows the values for the inner region, while the bottom panel presents the values for the outer region. Colour-coding is the same as in previous figures. Stars represent the median value for each type of galaxy in each stellar mass bin. Squares represent the typical error along each axis colour for each type of galaxy.
Current usage metrics show cumulative count of Article Views (full-text article views including HTML views, PDF and ePub downloads, according to the available data) and Abstracts Views on Vision4Press platform.
Data correspond to usage on the plateform after 2015. The current usage metrics is available 48-96 hours after online publication and is updated daily on week days.
Initial download of the metrics may take a while.