Fig. 1.
Download original image
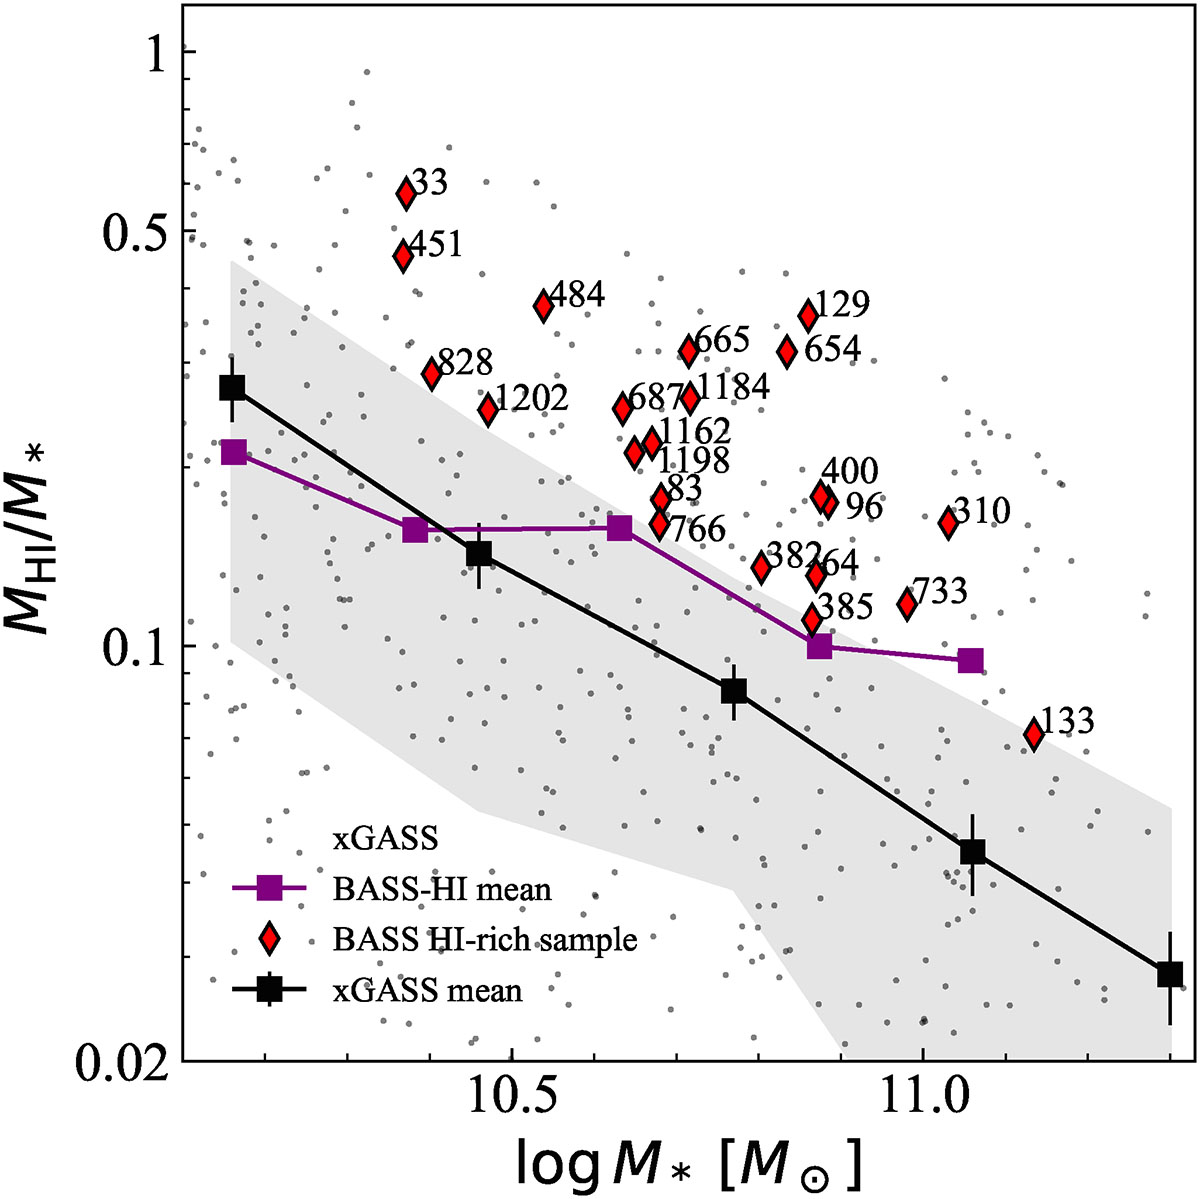
H I gas mass fraction of the sample as a function of stellar mass. The red diamonds show our sample with BAT IDs, and the purple squares show the binned mean gas fraction of the entire BASS-H I-detected sample from single-dish measurements. The black dot points are the xGASS sample (Catinella et al. 2018), and the black squares and the grey shaded regions represent the binned mean value and the 5σ scatter of the same sample, respectively.
Current usage metrics show cumulative count of Article Views (full-text article views including HTML views, PDF and ePub downloads, according to the available data) and Abstracts Views on Vision4Press platform.
Data correspond to usage on the plateform after 2015. The current usage metrics is available 48-96 hours after online publication and is updated daily on week days.
Initial download of the metrics may take a while.