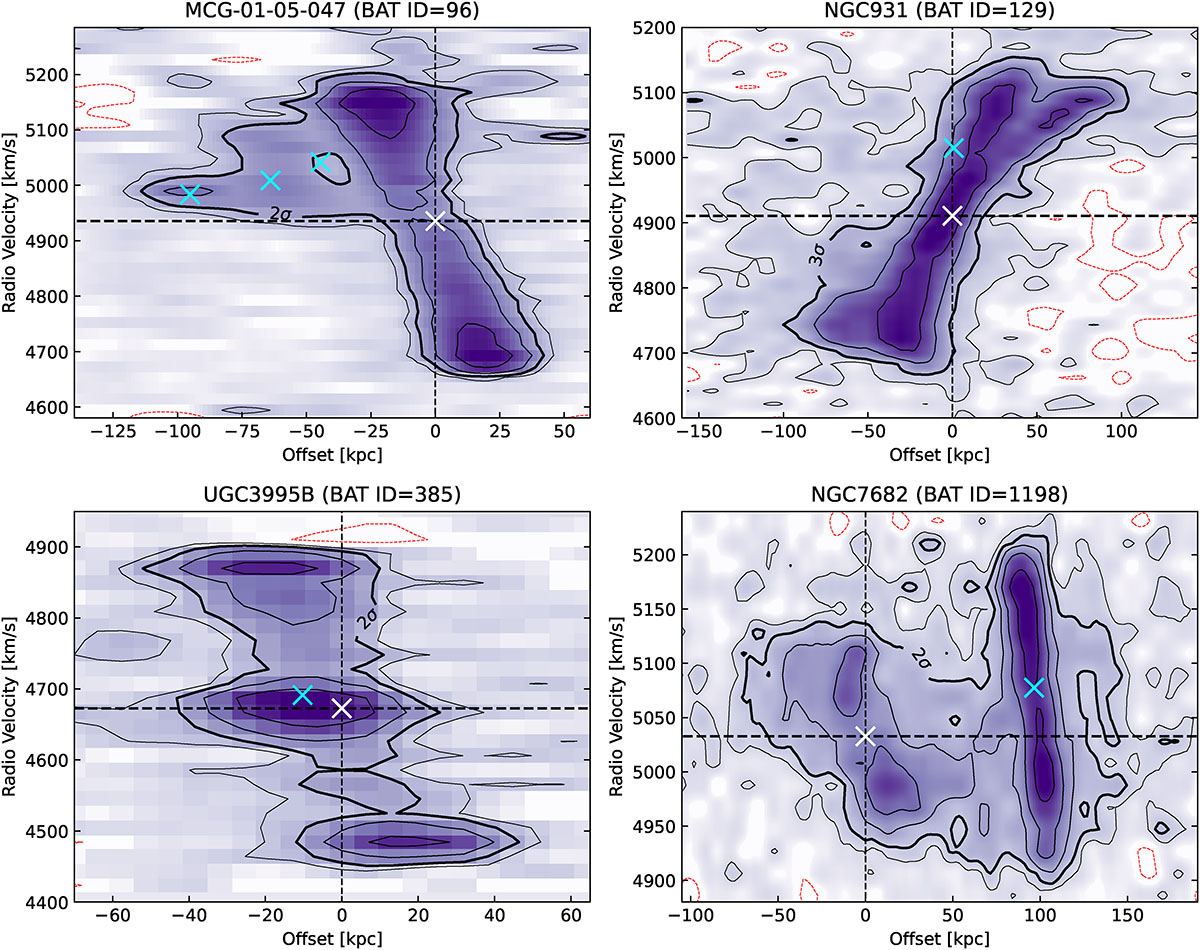
Fig. C.1.
Download original image
H I PVDs for BAT IDs 96, 129, 385, and 1198. The outer contour levels are [-1σ, 1σ], where negative lines are shown in dotted red lines. The inner contour levels are 2n × σ, where n = 2,3,4, and so on, with the 2σ or 3σ level indicated by a thick contour in each plot. The velocities and projected offsets of neighboring galaxies, derived as described in the text, are overlaid as colored crosses in each panel. In MCG-01-05-047, a diffuse H I envelope appears to connect the galaxy with its two neighbors, both spatially and in the receding velocity field. For NGC 931, a gas component deviating from the main disk kinematics is present in the approaching-velocity channels. Although its precise location cannot be resolved with the current H I beam, it is likely a signature of external gas inflow (see also Figure 19 of Kuo et al. 2008). In the case of UGC 3995, the H I PVD shows three peaks. The components are not spatially resolved because the two galaxies form a tight pair (see Figure B.1). However, as shown in Figure 34 of Kuo et al. 2008, one gas disk appears in the approaching channels while the other becomes visible in the receding channels. Finally, NGC 7682 and NGC 7679 clearly share a common H I envelope that spans a velocity range of ∼150 km s−1 (see Figure 4 of Kuo et al. 2008, for a channel map).
Current usage metrics show cumulative count of Article Views (full-text article views including HTML views, PDF and ePub downloads, according to the available data) and Abstracts Views on Vision4Press platform.
Data correspond to usage on the plateform after 2015. The current usage metrics is available 48-96 hours after online publication and is updated daily on week days.
Initial download of the metrics may take a while.