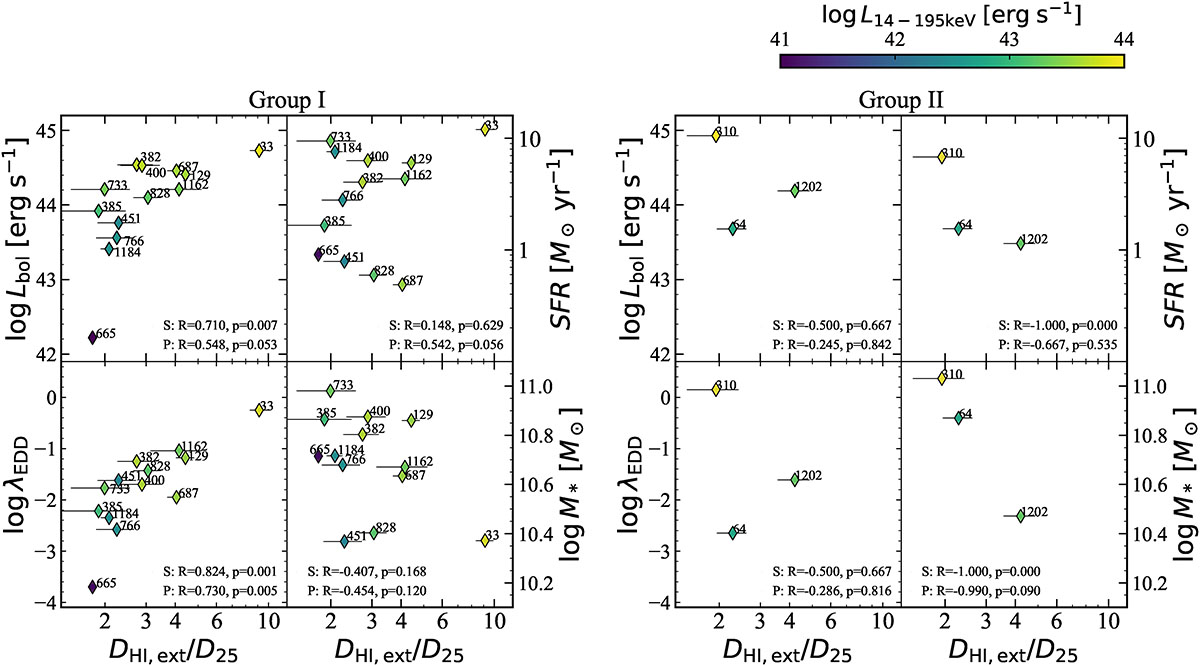
Fig. D.1.
Download original image
Same as Figure 6 divided into subsamples. (left) Group I: Subgroup with at least one gas-poor neighbors, or neighbor(s) with no H I. (Panel (a), (b), and (d) in Figure 5). (right) Group II: Subsample with only gas-rich neighbors (Panel (c) in Figure 5). Group I systems are showing tighter correlation of Bolometric luminosity (Lbol), Eddington ratio (λEdd) as a function of the relative extent of H I gas including low-density gas (DHI, ext) to stellar disk (D25). Hence, Group I systems are more likely to have exchanged gas with their surroundings, compared to the Group II shown in the right panel, where these systems are likely in an earlier phase of group interaction.
Current usage metrics show cumulative count of Article Views (full-text article views including HTML views, PDF and ePub downloads, according to the available data) and Abstracts Views on Vision4Press platform.
Data correspond to usage on the plateform after 2015. The current usage metrics is available 48-96 hours after online publication and is updated daily on week days.
Initial download of the metrics may take a while.