Fig. 2.
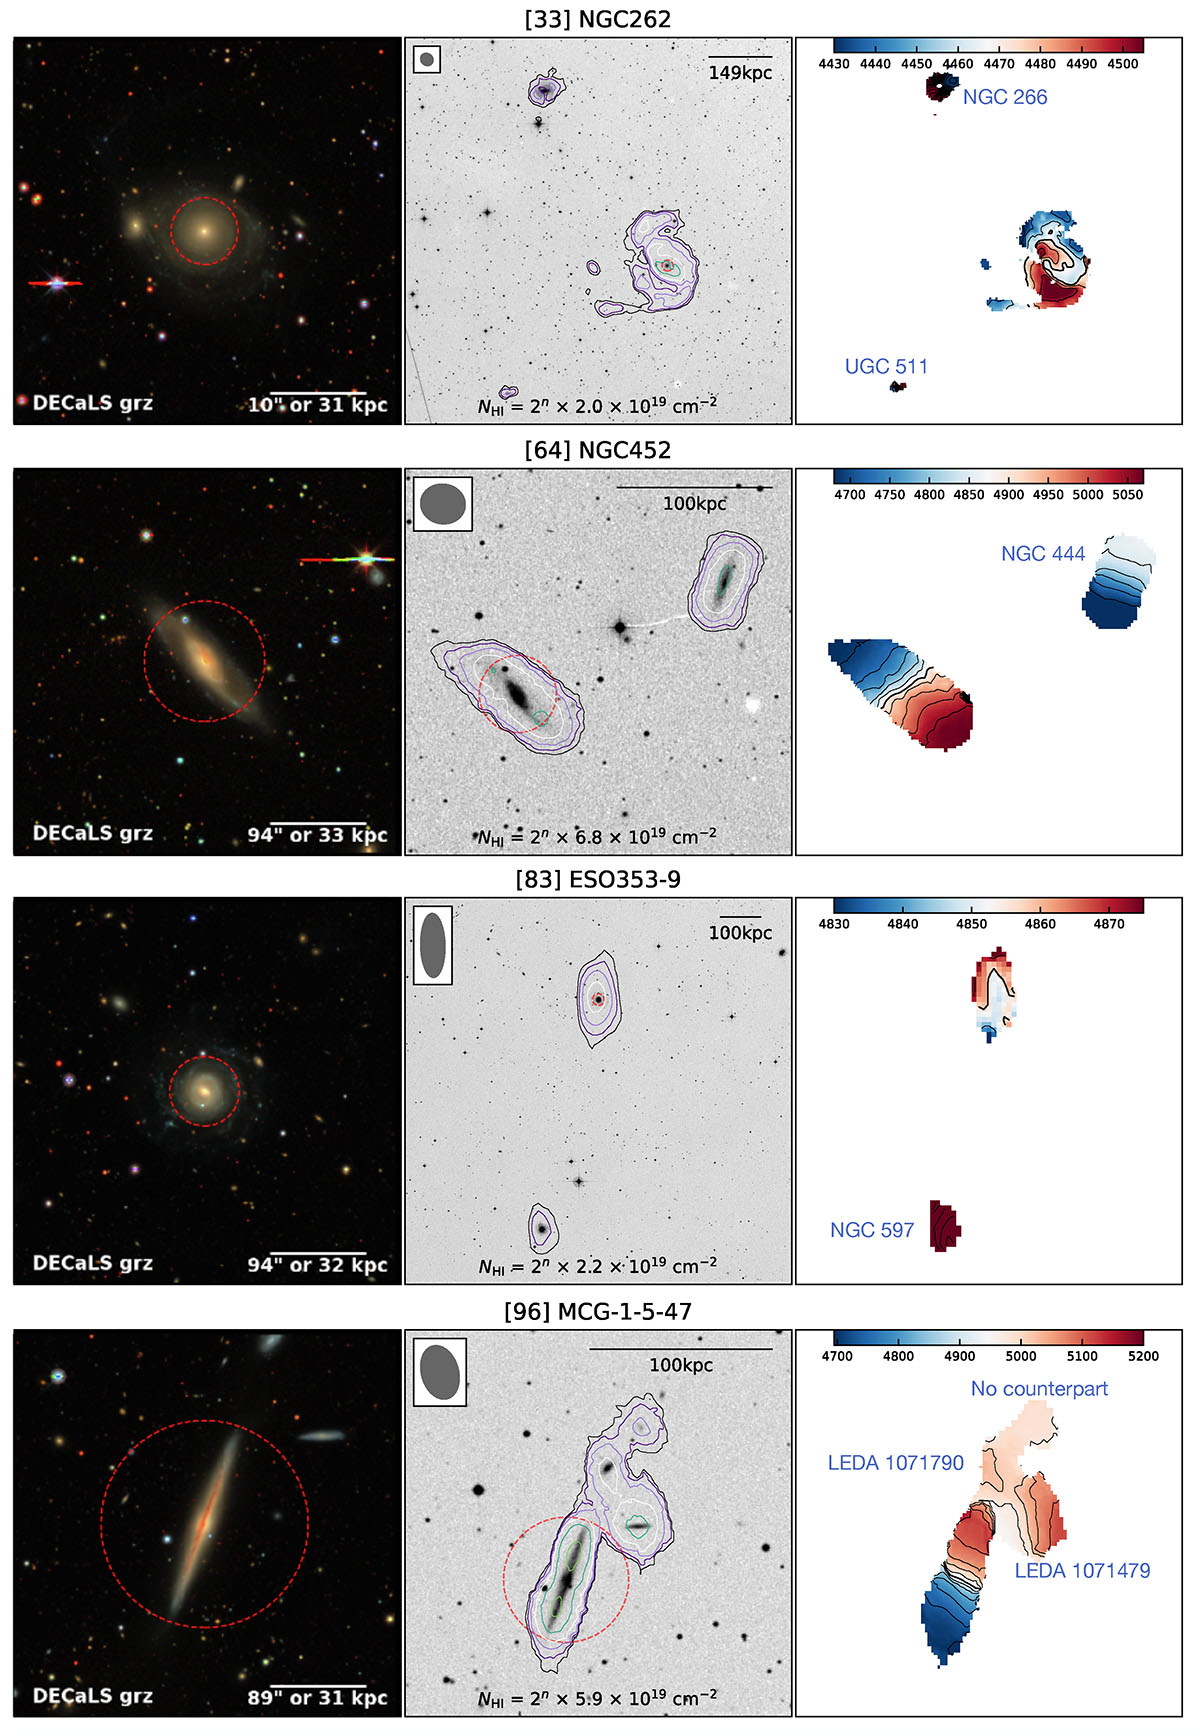
Download original image
Images of the first four galaxies. The rest of the samples are presented in the Appendix A. (Left) The optical color image. The angular and physical scale bar is shown on the bottom right of each panel. (Center) The integrated H I intensity contours overlaid on the DSS-1 image. The synthesized beam is shown on the upper left of each panel. The contour levels are (the lowest contour level in cm−2 which is presented at the bottom) × 2n, where n = 0, 1, 2, 3, and so on. Various contour colors are used to reveal the inner stellar structure clearly, and they are not associated with specific column densities. The scale bar shows 50, 100, or 150 kpc at the given distances of each galaxy. (Right) The moment 1 (velocity field) map. The central velocity is listed at the bottom and indicated by a thick line. In the approaching/receding side (blue/red) of the disk, velocities are indicated with solid/dashed lines, with a separation of 40 km s−1, except for NGC 262, ESO353-G009, and NGC 6232, for which are separated by 15 km s−1. The colorbar on the top of the panel is in the unit of km s−1. The names of H I-detected neighbor(s) are noted in blue.
Current usage metrics show cumulative count of Article Views (full-text article views including HTML views, PDF and ePub downloads, according to the available data) and Abstracts Views on Vision4Press platform.
Data correspond to usage on the plateform after 2015. The current usage metrics is available 48-96 hours after online publication and is updated daily on week days.
Initial download of the metrics may take a while.