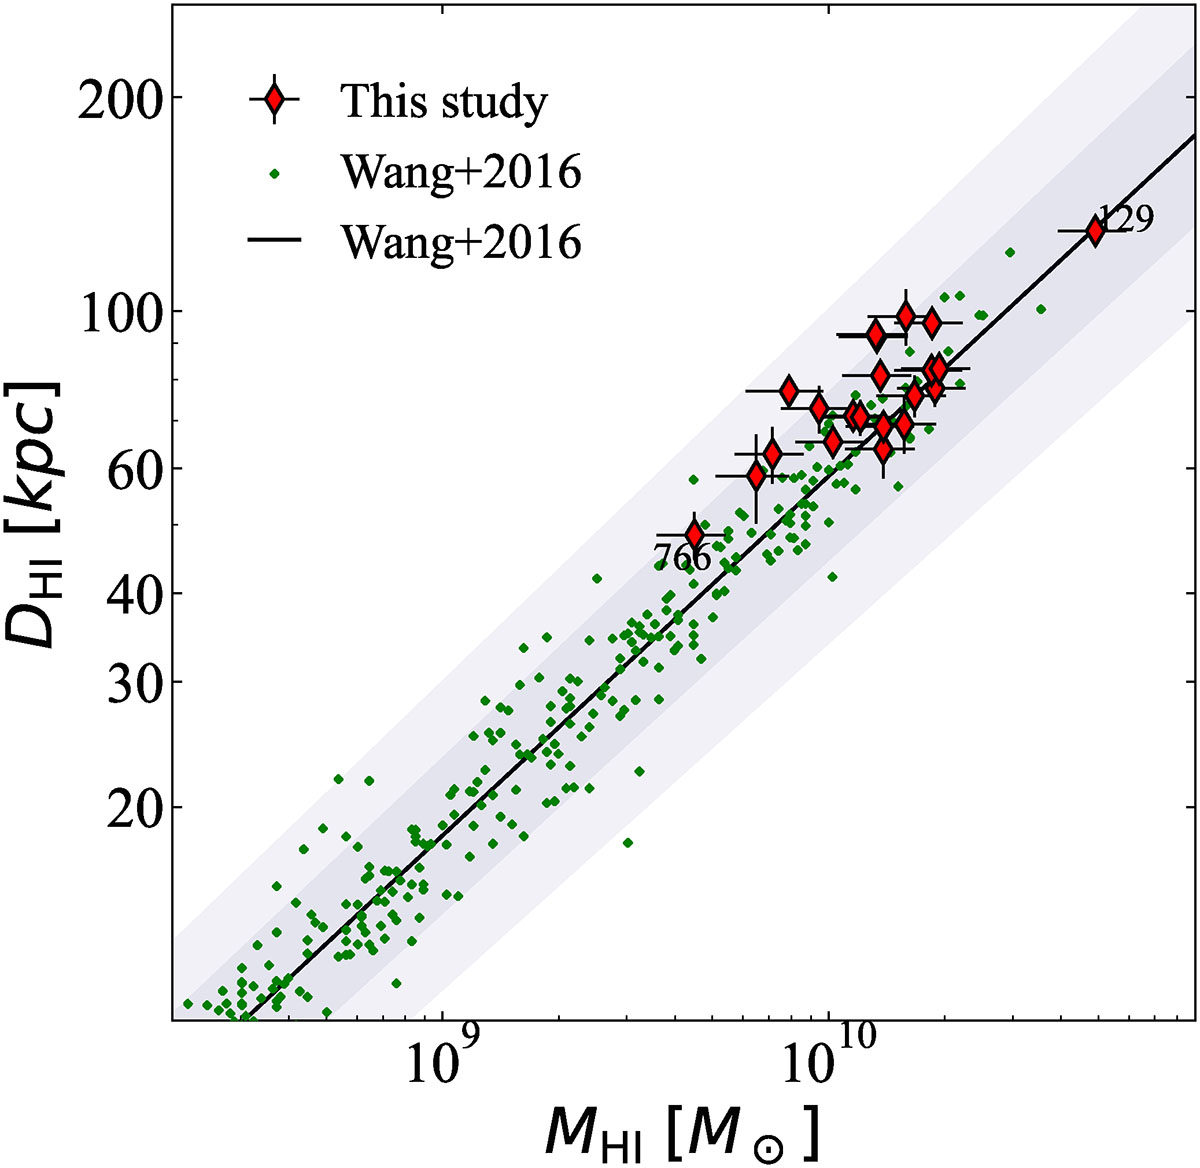
Fig. 3.
Download original image
H I mass and size scaling relation. The green dots represent ∼500 nearby galaxies analyzed by Wang et al. (2016). The solid black line shows the best fit of Wang et al. (2016)’s sample, and grey colors show its 3σ and 6σ scatters. The errorbars of DHI and MHI measurements are plotted. The red diamonds represent the sample for this study. Most of our targets follow the scaling relation within a 3σ scatter and are clustered in the high MHI–DHI regime. The objects that deviate most significantly from the rest of our sample are labeled with their BAT IDs.
Current usage metrics show cumulative count of Article Views (full-text article views including HTML views, PDF and ePub downloads, according to the available data) and Abstracts Views on Vision4Press platform.
Data correspond to usage on the plateform after 2015. The current usage metrics is available 48-96 hours after online publication and is updated daily on week days.
Initial download of the metrics may take a while.