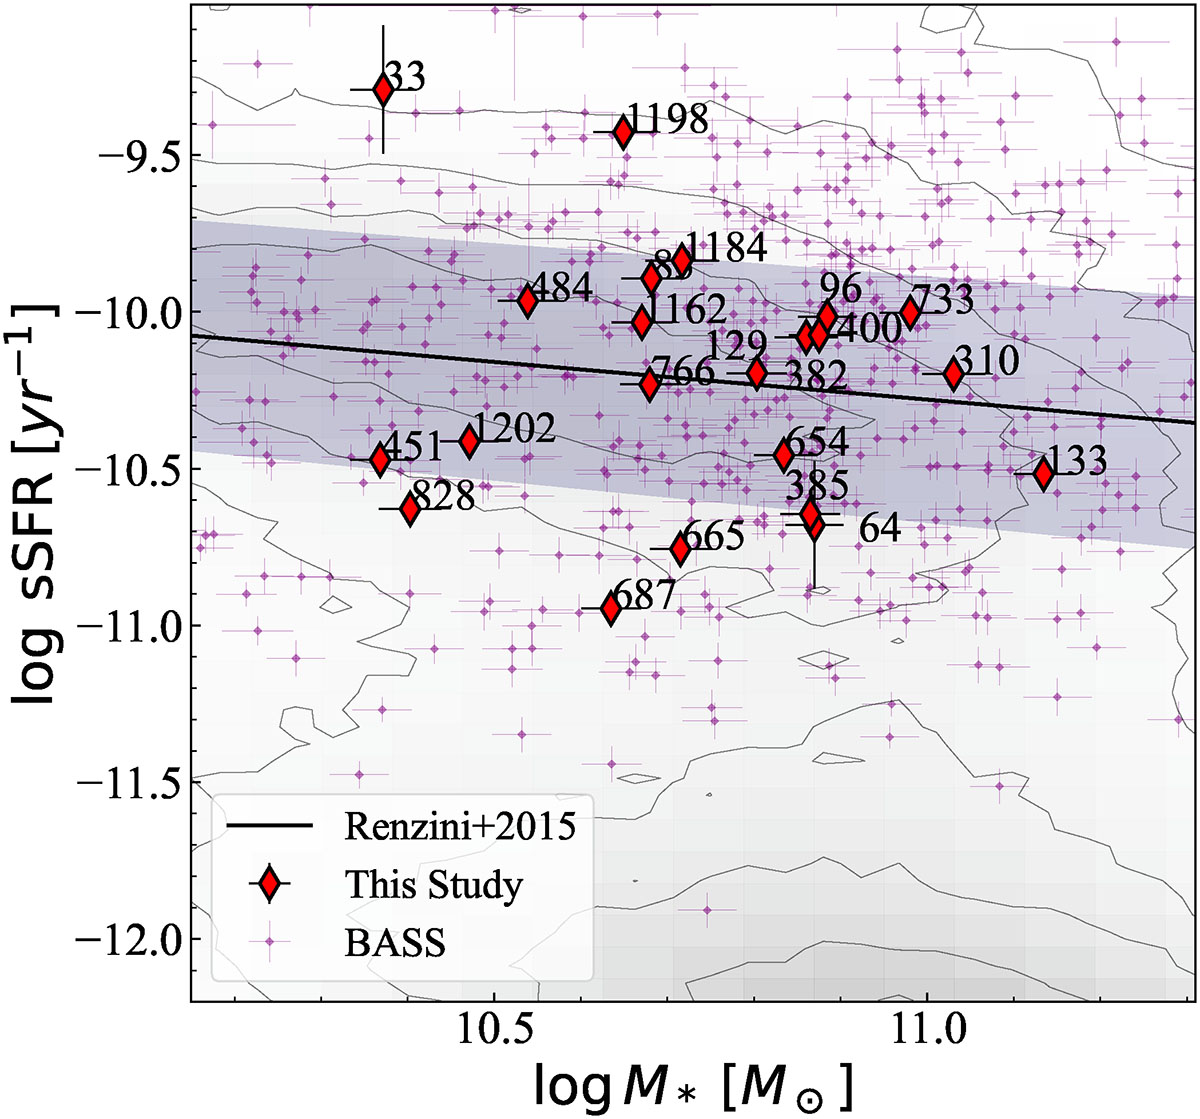
Fig. 4.
Download original image
Global star formation properties of the sample. The black solid line shows the scaling relation from Renzini & Peng (2015) with 3σ scatter (shaded area). The background data (greyscale) is from the MPA-JHU catalog (Brinchmann et al. 2004), where the contours represent 2D histograms corresponding to approximately 30, 100, 300, 500, 700, 800, and 841 thousand galaxies. The purple points represent all the BASS galaxies in which the star formation rate was measured (Ichikawa et al. 2019). The red diamonds represent our sample, with BAT IDs.
Current usage metrics show cumulative count of Article Views (full-text article views including HTML views, PDF and ePub downloads, according to the available data) and Abstracts Views on Vision4Press platform.
Data correspond to usage on the plateform after 2015. The current usage metrics is available 48-96 hours after online publication and is updated daily on week days.
Initial download of the metrics may take a while.