Fig. 5.
Download original image
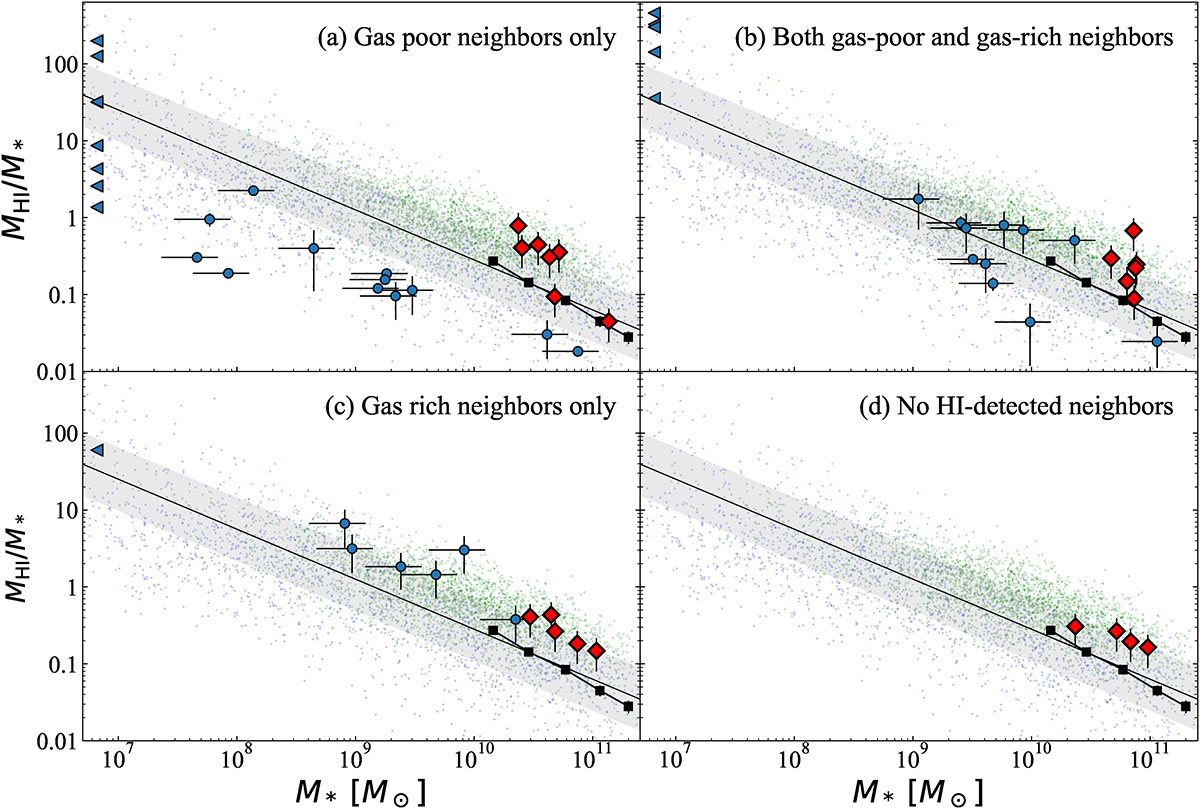
H I-to-stellar mass fraction vs. stellar mass for our targets (red diamonds) and their neighbors (blue circles). Panel (a) shows a subsample in which all H I-detected neighbors are gas poor for their given stellar mass. Panel (b) shows galaxies in which both gas-poor and gas-rich neighbors are observed. Panel (c) shows the cases with only gas-rich neighbors. Panel (d) shows the hosts with no other neighbors with H I detected in their surroundings. H I clouds detected in our observations but not visible in the 2MASS Ks-band are shown as triangles. The upper limit on their stellar mass was estimated by converting the 2MASS Ks-band surface brightness limit using the scaling relation from Kodama & Bower (2003), yielding a limit of 106.82 M⊙. The solid black line represents the scaling relation from the H I-selected spiral sample in the H I Parkes All-Sky Survey Catalog (HICAT; Meyer et al. 2004; Parkash et al. 2018), with the gray shaded area indicating the 1σ scatter. Background green points show HICAT data; blue points represent Nançay data (van Driel et al. 2016); and black squares indicate binned mean values from the xGASS sample (Catinella et al. 2018), as in Figure 1. Except for group (c), other host galaxies are likely to have acquired gas from their neighbors.
Current usage metrics show cumulative count of Article Views (full-text article views including HTML views, PDF and ePub downloads, according to the available data) and Abstracts Views on Vision4Press platform.
Data correspond to usage on the plateform after 2015. The current usage metrics is available 48-96 hours after online publication and is updated daily on week days.
Initial download of the metrics may take a while.