Fig. 1
Download original image
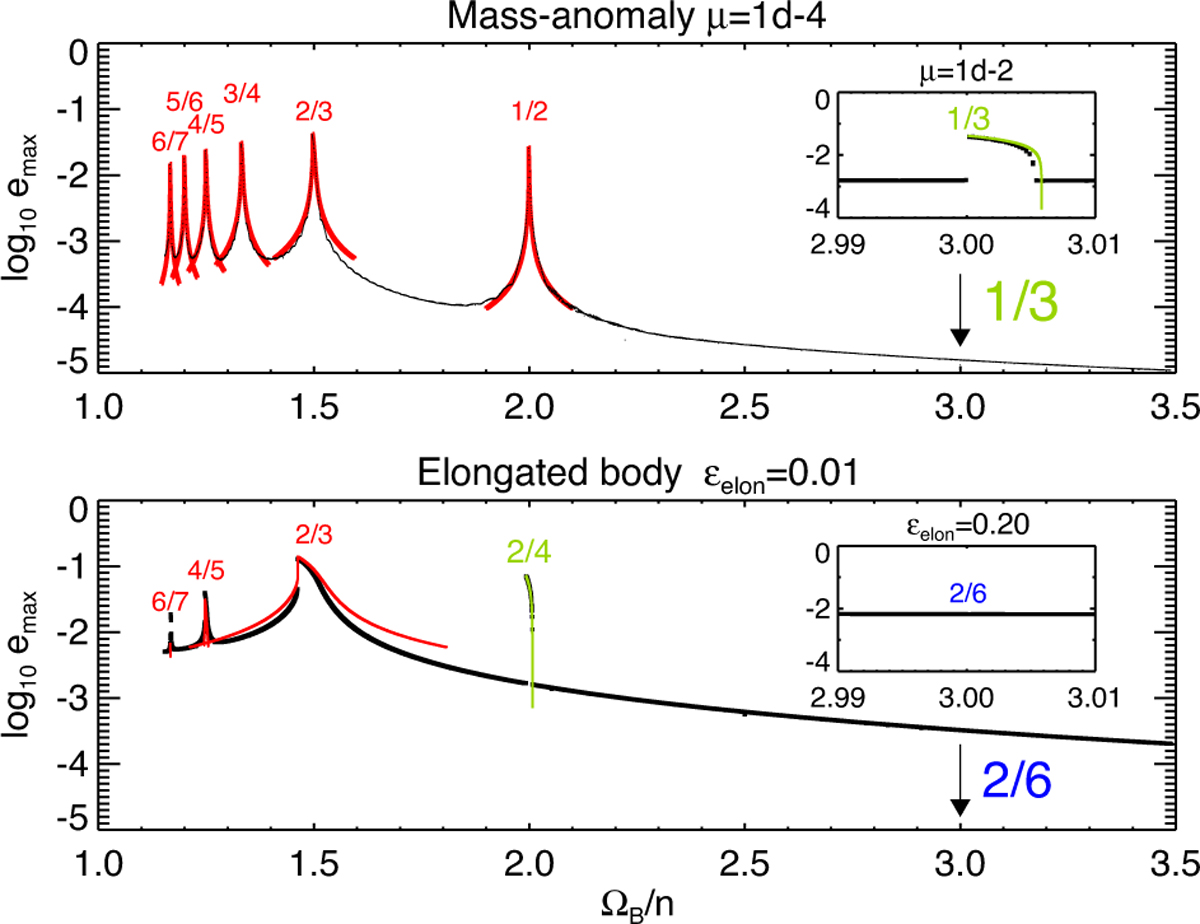
Comparison between the numerical and theoretical responses of test particles to various SORs. Numerical integrations followed the motion of 10 000 test particles initially distributed on circular orbits, during 10 000 revolutions of the central body. The maximum eccentricities emax reached by these particles are plotted in black as a function of ΩB/n = (a/acor)3/2, and are compared with the analytical estimates of Paper I (red or green curves). Upper panel: case of a spherical body with a mass anomaly µ = 10−4. Lower panel: case of a homogeneous triaxial ellipsoid with elongation ϵelon = 0.01 and oblateness f = 0. In the case of mass anomaly the strongest responses are at the outer first-order Lindblad resonances corresponding to commensurabilities n/ΩB = m/(m − 1), with m = −1, −2, −3… The inset in the upper panel is a zoomed-in image of the ΩB/n = 3 region, using a 100 times larger mass anomaly of µ = 0.01. The response to the second-order 1/3 resonance is now visible, and is compared to the analytical estimate in green. In the case of an elongated body, the π-symmetry of the perturbation imposes even values m = −2, −4, −6… for the first-order resonances. In this case the strongest second-order resonance (m = −2 and j = 2) is also visible, with the analytical response plotted in green. The inset in the lower panel is a zoomed-in image of the ΩB/n = 3 region. The fourth-order 2/6 resonance has no signature even when using a large value ϵelon = 0.20.
Current usage metrics show cumulative count of Article Views (full-text article views including HTML views, PDF and ePub downloads, according to the available data) and Abstracts Views on Vision4Press platform.
Data correspond to usage on the plateform after 2015. The current usage metrics is available 48-96 hours after online publication and is updated daily on week days.
Initial download of the metrics may take a while.