Fig. 11
Download original image
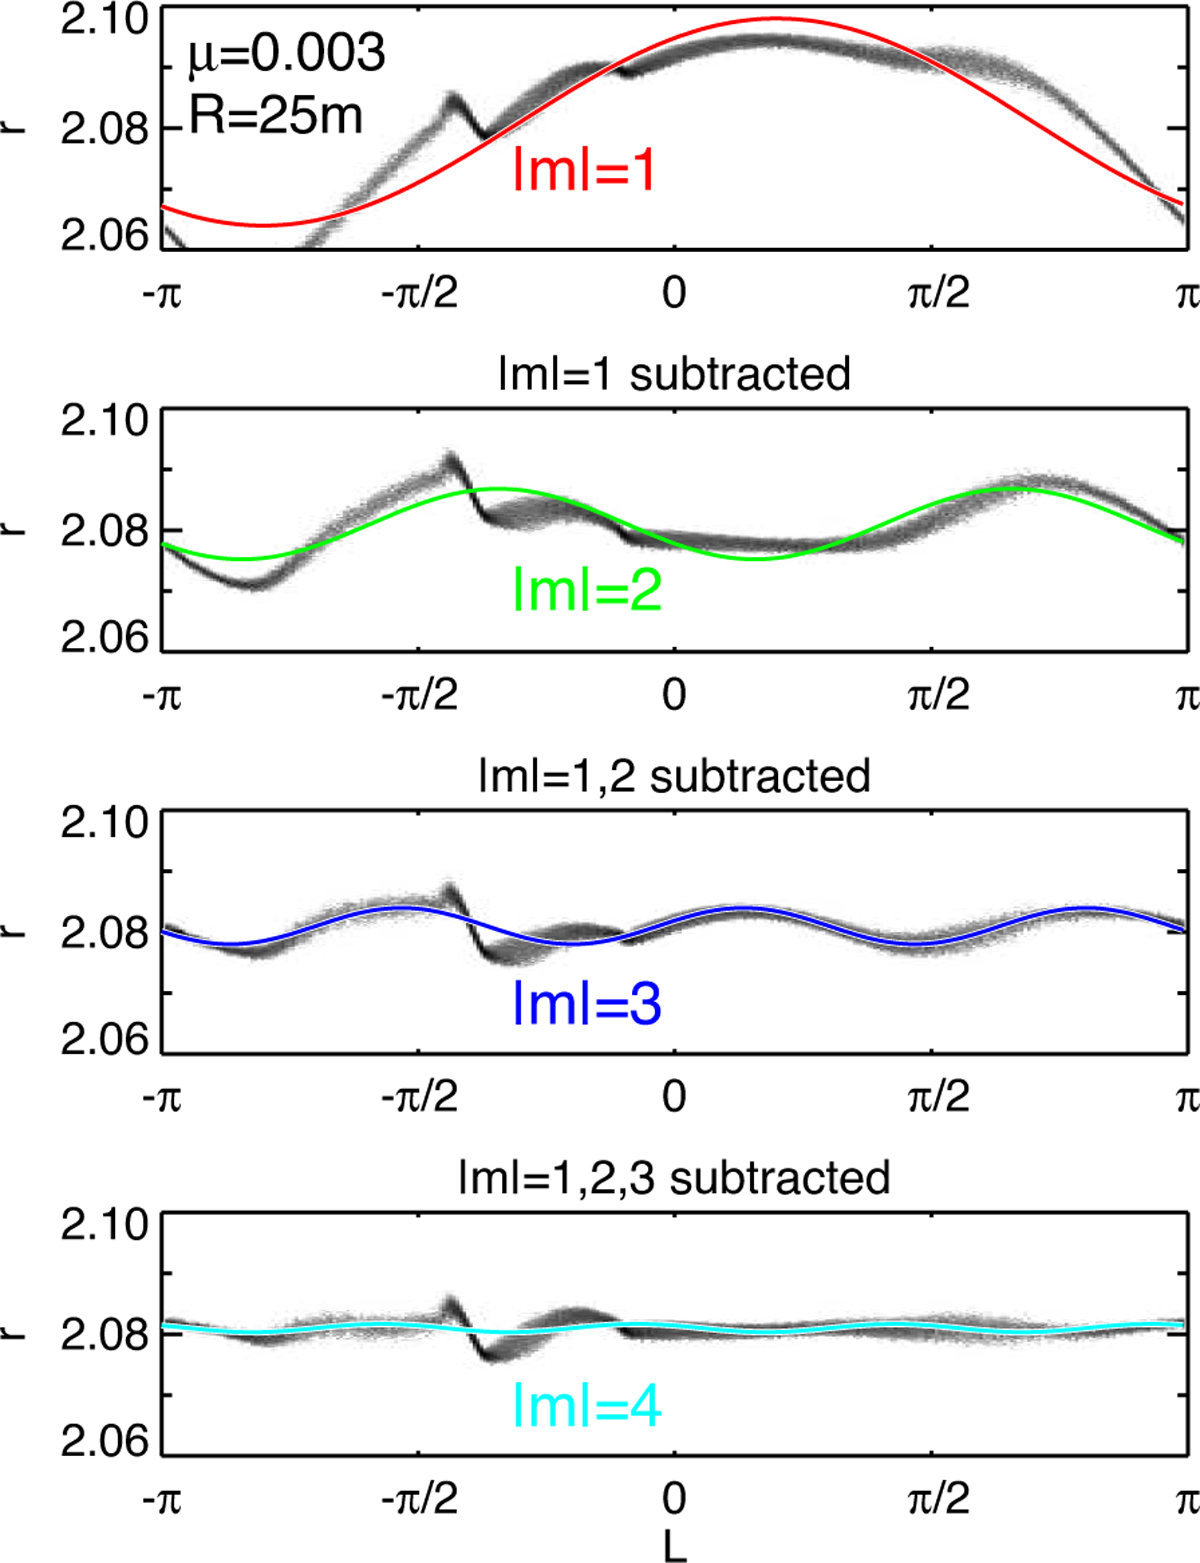
Fourier fits to the ring azimuthal profile in the µ = 0.003, R = 25 m simulation at T = 250 000 (same simulation as in Fig. 6). The uppermost frame shows r(L) profile, with a |m| = 1 fit superposed. The second frame shows the residual profile after subtracting the |m| = 1 component; the green curve is the |m| = 2 fit to the residual profile. The next frames repeat the procedure for |m| = 3 and |m| = 4.
Current usage metrics show cumulative count of Article Views (full-text article views including HTML views, PDF and ePub downloads, according to the available data) and Abstracts Views on Vision4Press platform.
Data correspond to usage on the plateform after 2015. The current usage metrics is available 48-96 hours after online publication and is updated daily on week days.
Initial download of the metrics may take a while.