Fig. 12
Download original image
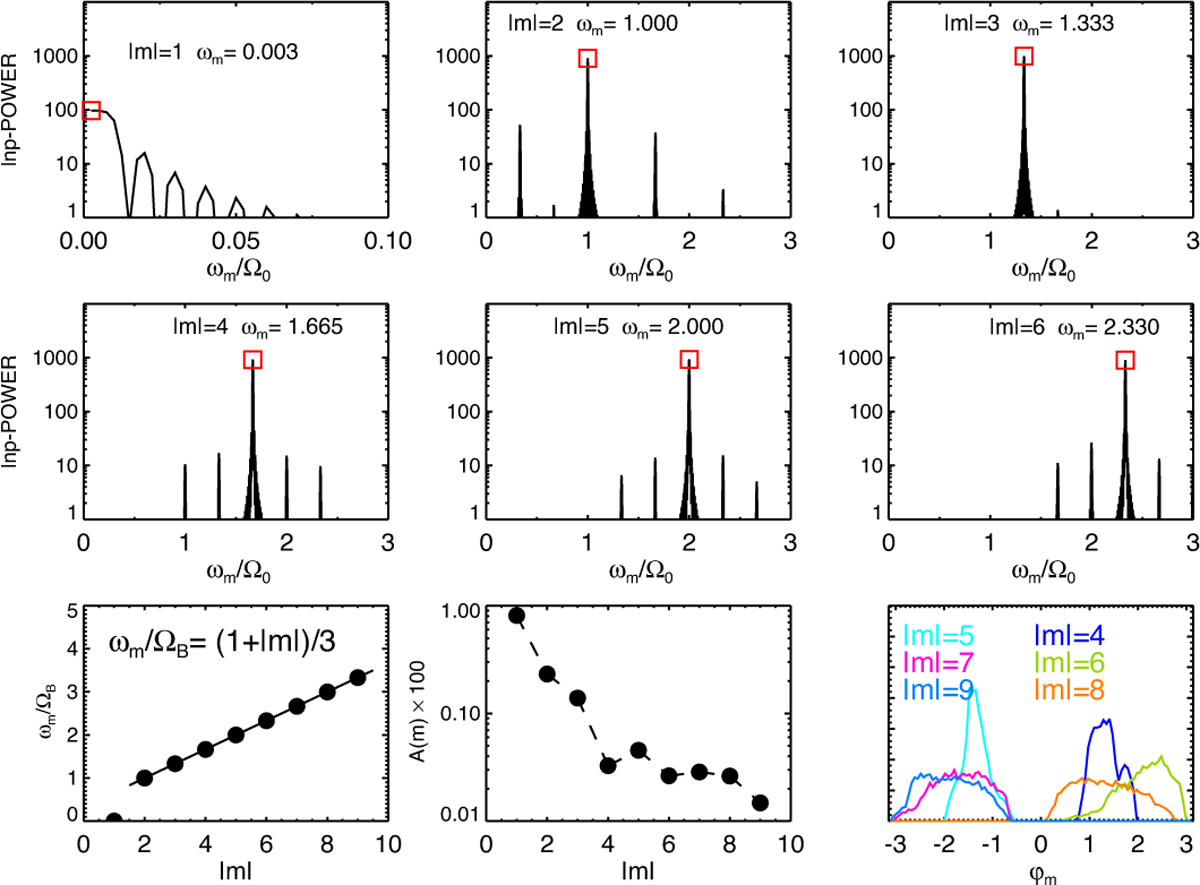
Proper Lindblad modes appearing in a ring confined at the 1/3 SOR. The outputs of the run shown in Fig. 6 have been used to detect normal modes in the confined rings between times 250 000 and 250 200, with steps ∆T = 0.05. The Lomb normalized periodogram power spectra of the modes described by Eq. (13) are displayed in the upper six panels as a function of ωm/ΩB for |m| = 1 to 6. Consistent with Eq. (15), the maximum power (red squares) is reached at the frequency ωm = (1 + |m|)ΩB/3. This is illustrated in the lower left panel. The lower middle panel shows the rapid decrease in the amplitude Am of the modes with |m|, while the right panel shows the distribution of phases ϕm.
Current usage metrics show cumulative count of Article Views (full-text article views including HTML views, PDF and ePub downloads, according to the available data) and Abstracts Views on Vision4Press platform.
Data correspond to usage on the plateform after 2015. The current usage metrics is available 48-96 hours after online publication and is updated daily on week days.
Initial download of the metrics may take a while.