Fig. 14
Download original image
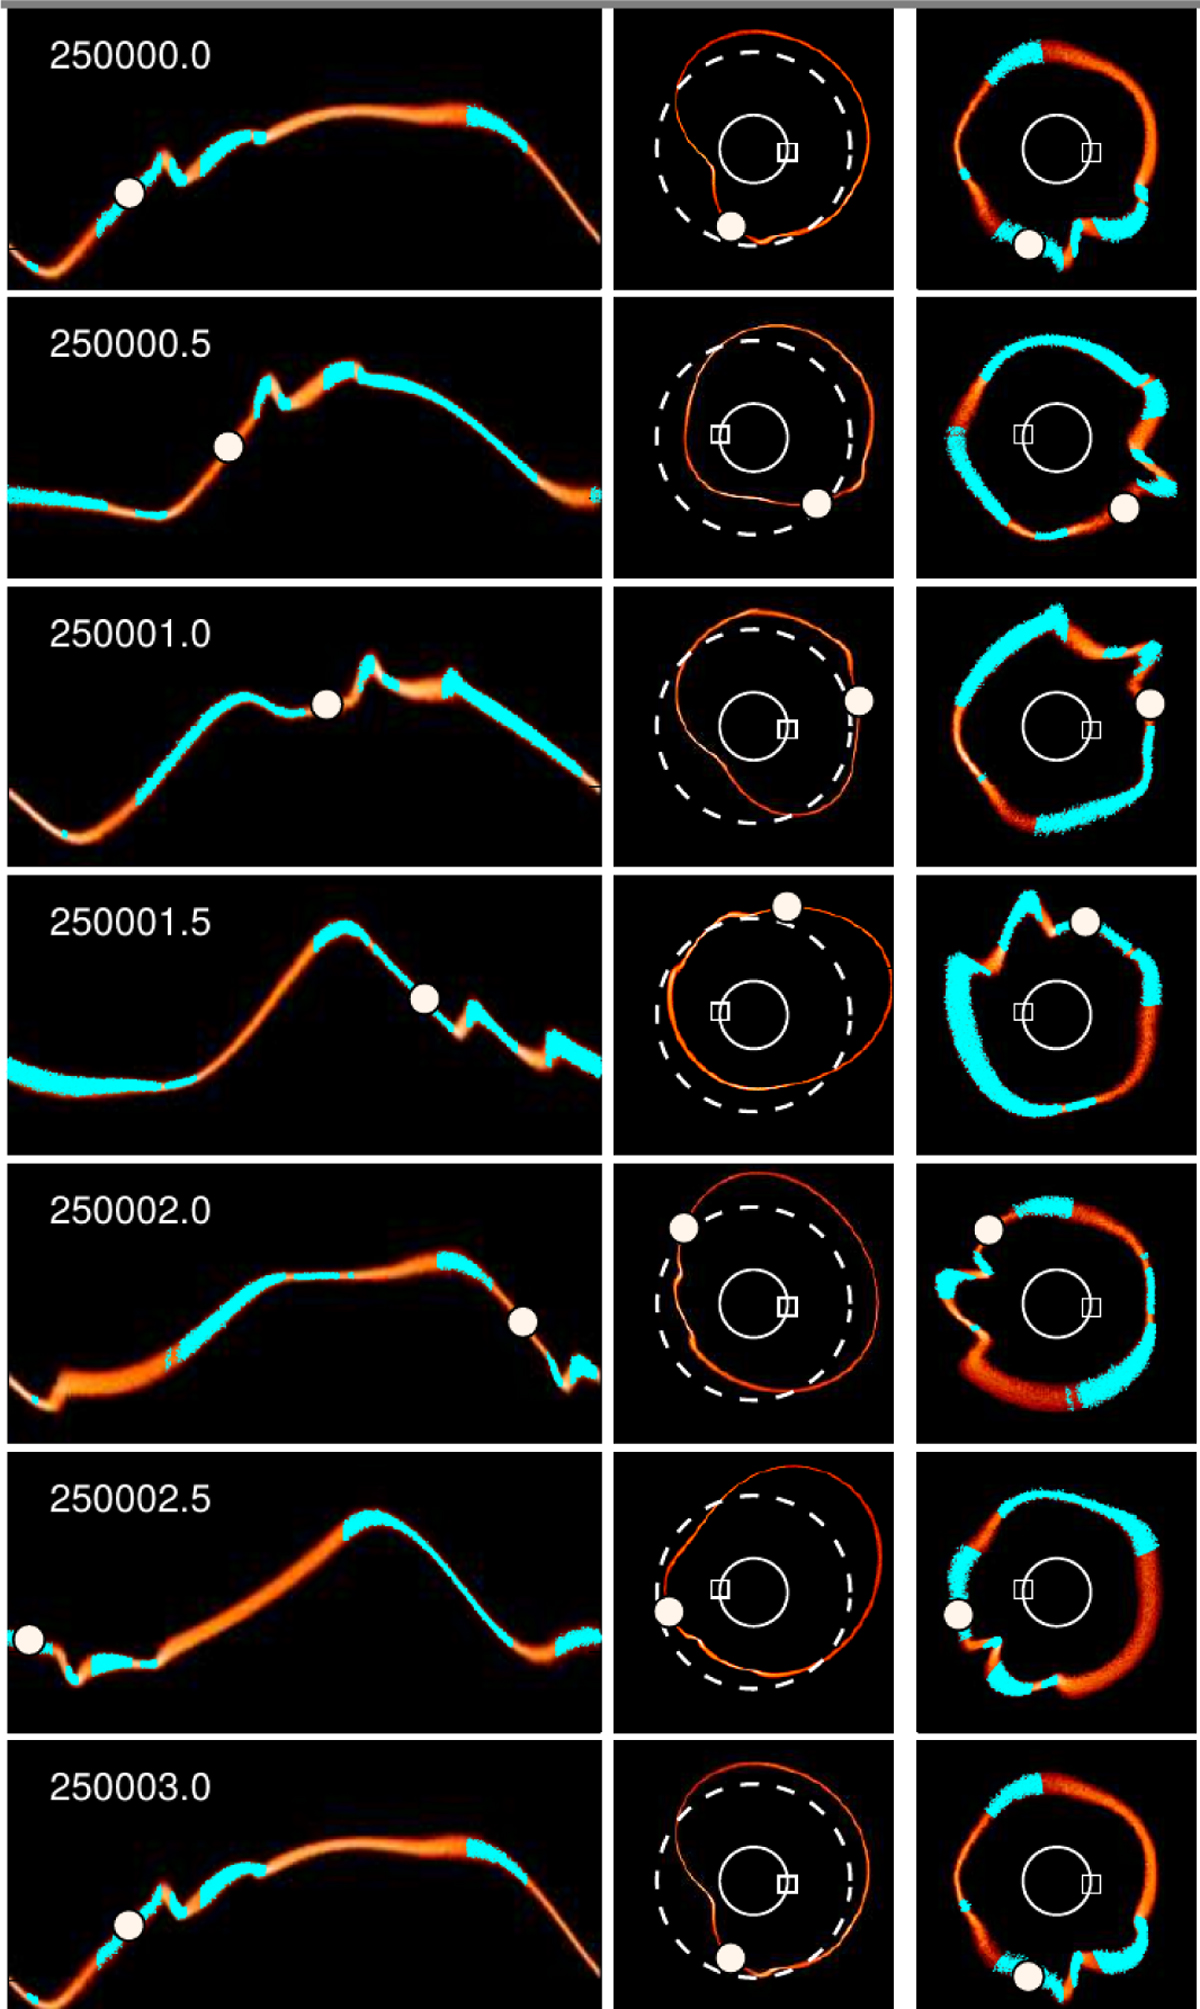
Local shear reversal in 1/3 SOR ringlet. The evolution of the µ = 0.003, R = 25 m simulation is shown over one ring orbital period (or three central body revolutions). The left frames display the r(L) profiles, with radial range 2.05–2.12. The ring patches with negative angular momentum flux Trt are indicated in light blue, while the white bullet indicates the location of a tracer particle. The middle frames show cartesian projections, where the ring deviations from its mean distance (dashed curve) have been exaggerated by a factor of 40 at each azimuth, and the open square marks the location of the mass anomaly. Similarly, in the right frames (again a cartesian projection) the ring width variations have been exaggerated by a factor of 50, using the same color convention as in the left frames. For the construction of all the figures, 20 snapshots of the ring separated by ∆T = 3, 6, …57 have been stacked.
Current usage metrics show cumulative count of Article Views (full-text article views including HTML views, PDF and ePub downloads, according to the available data) and Abstracts Views on Vision4Press platform.
Data correspond to usage on the plateform after 2015. The current usage metrics is available 48-96 hours after online publication and is updated daily on week days.
Initial download of the metrics may take a while.