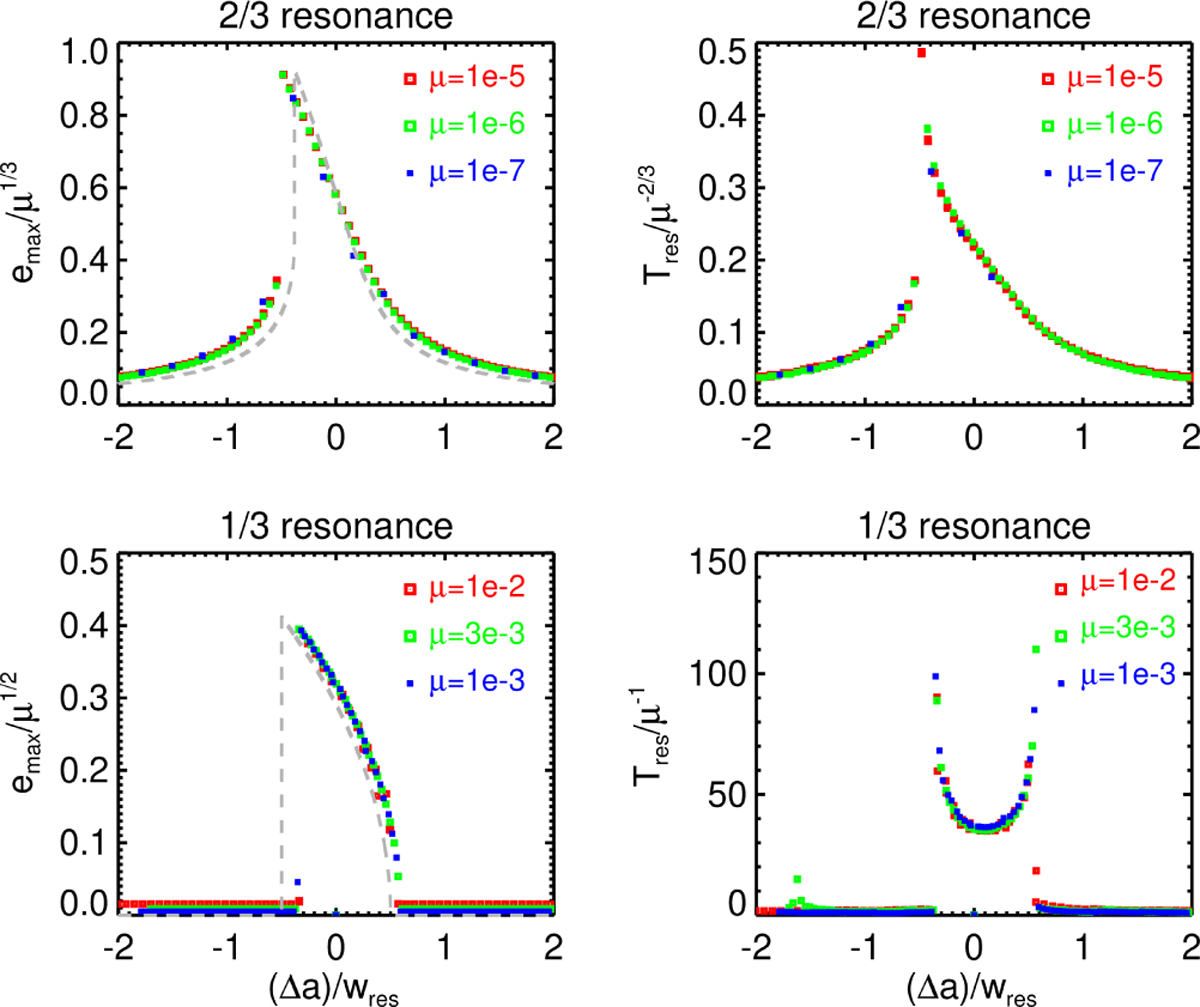
Fig. 2
Download original image
Responses of test particles to the first-order 2/3 and second-order 1/3 SORs. Left column: symbols represent the maximum eccentricities emax reached by particles initially on circular orbits for three values of the mass anomaly µ, near the 2/3 SOR (upper panel) and the 1/3 SOR (lower panel). The gray dashed curves are the analytical estimates of emax displayed in Figs. 3 and 4 of Paper I. The points are plotted against the normalized distance to the resonance, Δa/Wres = (ā − a0)/Wres, where a0 is the radius of the circular orbit at exact resonance, ā is the modified semimajor axis (Eq. (2)), and Wres is the width of the resonance (Eq. (3)). Right column: same, but with the timescales of Tres necessary to reach the maximum eccentricities emax. This figure shows that our numerical integrations reproduce satisfactorily the calculated distribution of emax, as well as the µ-scaling expected from Eqs. (3) and (4).
Current usage metrics show cumulative count of Article Views (full-text article views including HTML views, PDF and ePub downloads, according to the available data) and Abstracts Views on Vision4Press platform.
Data correspond to usage on the plateform after 2015. The current usage metrics is available 48-96 hours after online publication and is updated daily on week days.
Initial download of the metrics may take a while.