Fig. 20
Download original image
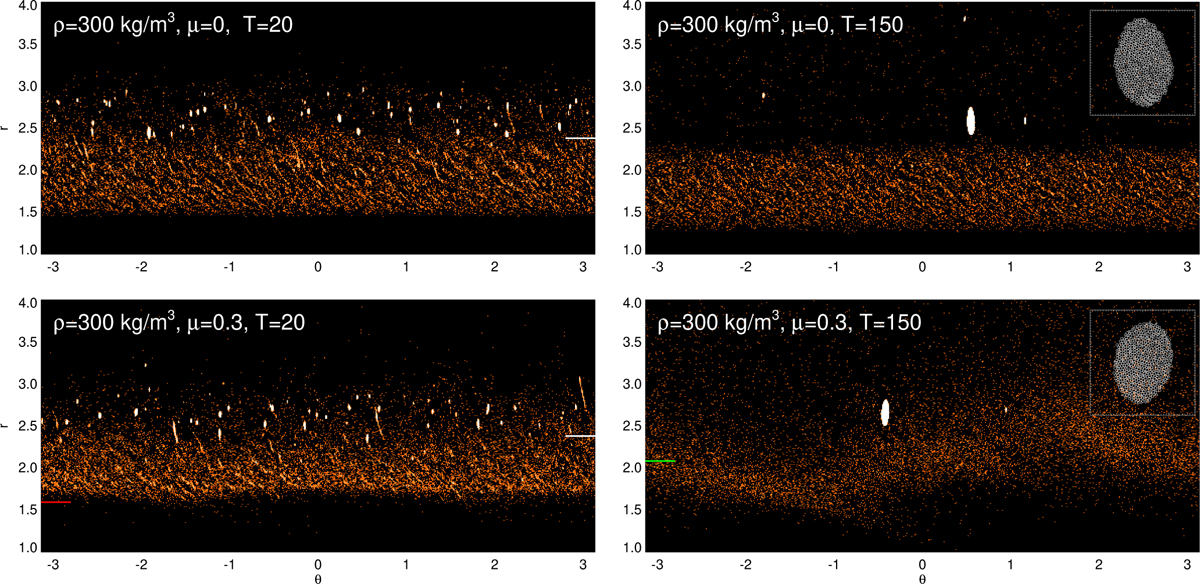
Self-gravitating simulations with R = 0.005 (corresponding to a physical radius of 1 km in the Chariklo case), assuming particles with bulk density ρ = 300 kg m−3. The initial distribution extends to r = 1.55–2.8, which corresponds to the range rh = 0.75–1.35. With N = 24 000 particles the initial τ0 = 0.11. The upper row shows two snapshots of the simulation with no mass anomaly, while the lower row shows a simulation with a µ = 0.3 mass anomaly. The location of the 1/3 SOR (a = 2.08) corresponds to rh ≈ 1.0. In the T = 20 frames, the tick marks on the right vertical axis indicate the radii where rh = 1.15. The red and green solid lines in the µ = 0.3 frames indicate the locations of 1/2 (left) and 1/3 (right) SOR. The insets in the T = 150 frames zoom in on the largest aggregate formed during the run, covering a 0.4 × 0.4 region with a correct aspect ration. The slice of the aggregate through the z = 0 plane is shown.
Current usage metrics show cumulative count of Article Views (full-text article views including HTML views, PDF and ePub downloads, according to the available data) and Abstracts Views on Vision4Press platform.
Data correspond to usage on the plateform after 2015. The current usage metrics is available 48-96 hours after online publication and is updated daily on week days.
Initial download of the metrics may take a while.