Fig. 21
Download original image
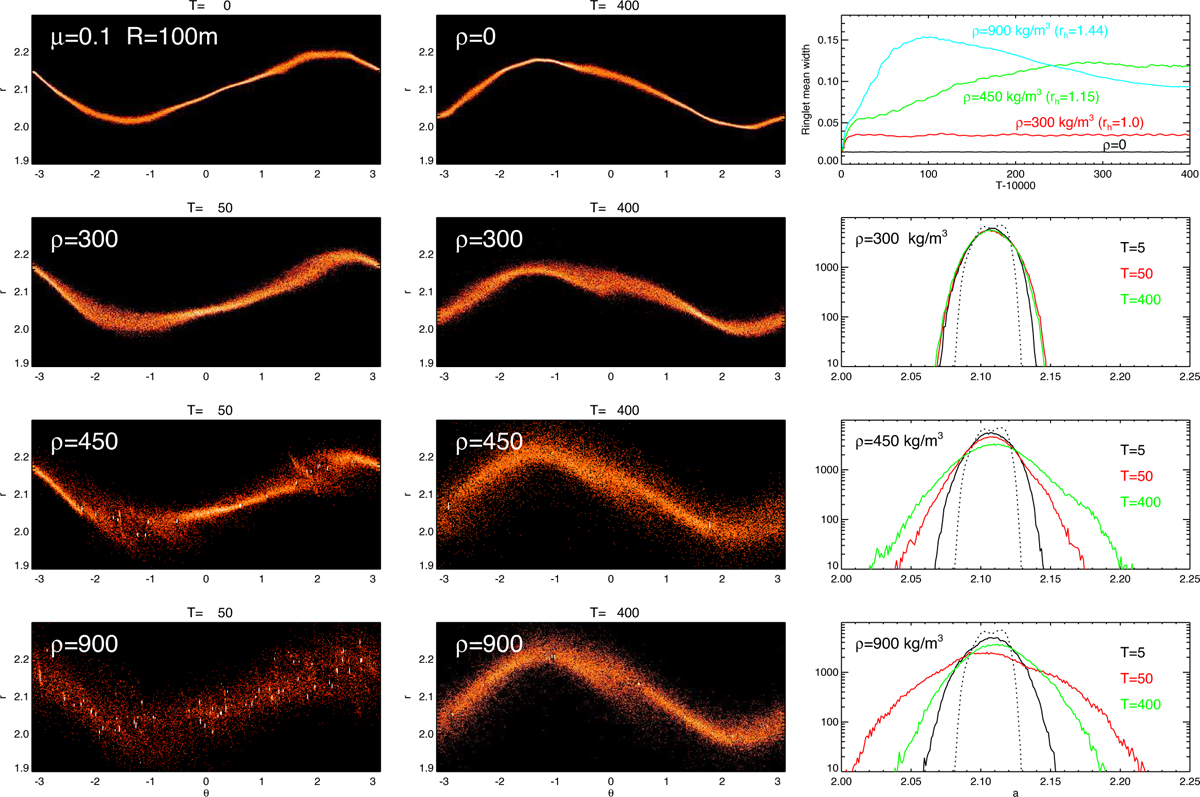
Self-gravitating simulations of N=30 000 particles with different bulk densities. Simulations continue from the ringlet stage (at T = 10 000) of the nongravitating simulation of Fig. 9 with µ = 0.1, R = 0.0005 (100 m in Chariklo’s case): the snapshot of the initial state is shown in the upper left frame. The other frames display self-gravitating simulations with ρ= 300, 450, and 900 kg m−3, corresponding to rh = 1.0, 1.15, and 1.44, respectively at the distance of the 1/3 SOR. Times are counted from the beginning of the self-gravitating simulation. The upper right frame displays the evolution of the ringlet mean width, ![]() , where rfit denotes the fitted ringlet central line at the azimuth of the particle and the averaging is over all particles (for a uniform particle distribution this formula with the factor of 12 recovers the full width of the ringlet). The remaining frames on the right show the semimajor axis distribution at different instants for the three self-gravitating runs.
, where rfit denotes the fitted ringlet central line at the azimuth of the particle and the averaging is over all particles (for a uniform particle distribution this formula with the factor of 12 recovers the full width of the ringlet). The remaining frames on the right show the semimajor axis distribution at different instants for the three self-gravitating runs.
Current usage metrics show cumulative count of Article Views (full-text article views including HTML views, PDF and ePub downloads, according to the available data) and Abstracts Views on Vision4Press platform.
Data correspond to usage on the plateform after 2015. The current usage metrics is available 48-96 hours after online publication and is updated daily on week days.
Initial download of the metrics may take a while.