Fig. 22
Download original image
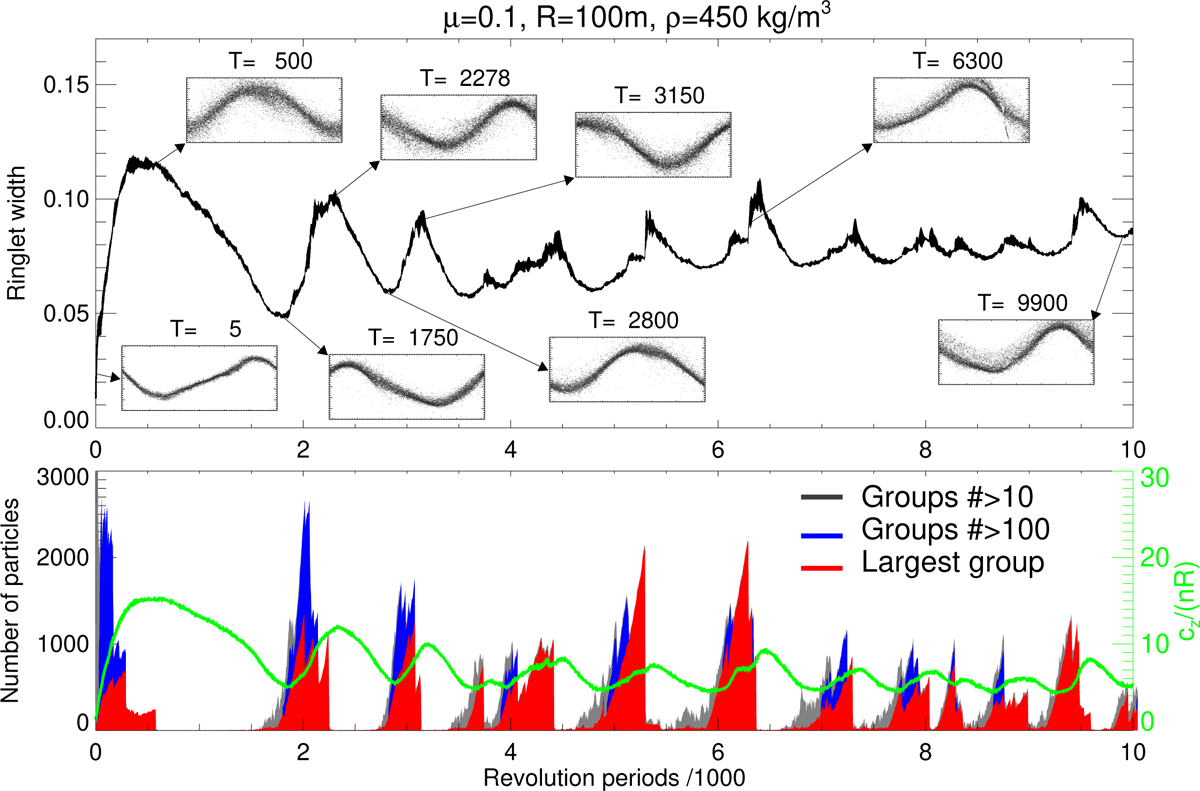
Self-gravitating simulations with µ = 0.1, R = 0.0005 (100 m in Chariklo’s case), assuming particles with bulk density ρ = 450 kg m−3. The initial particle distribution is similar to that in Fig. 21, except that τ has been reduced by a factor of 2 by selecting only every other particle from the confined ringlet in the nongravitating simulation at T = 10 000. The upper frame displays the evolution of the ringlet mean width, together with snapshot corresponding to various width maxima and minima; the snapshot at T = 6300 displays the system just after tidal breakup of the largest aggregate. The lower frame displays the number of particles in the largest aggregate (red) and the total number of particles in groups with more than 100 (blue) and 10 particles (gray; the total number of particles N = 15 000). Also shown as a green curve is the vertical dispersion cz (labels on the right).
Current usage metrics show cumulative count of Article Views (full-text article views including HTML views, PDF and ePub downloads, according to the available data) and Abstracts Views on Vision4Press platform.
Data correspond to usage on the plateform after 2015. The current usage metrics is available 48-96 hours after online publication and is updated daily on week days.
Initial download of the metrics may take a while.