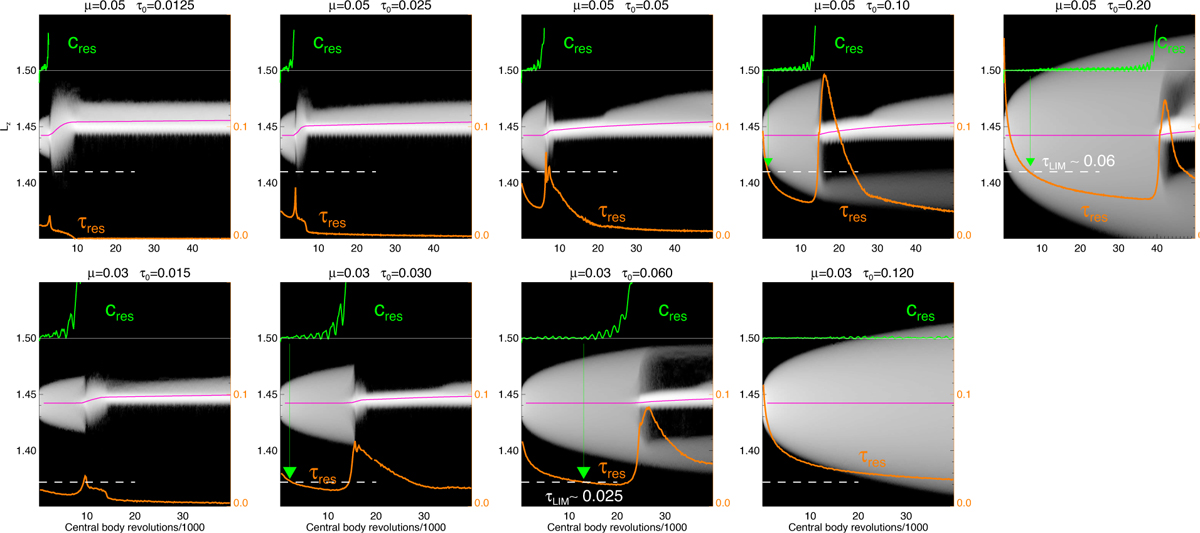
Fig. C.3
Download original image
Effect of optical depth on the resonance accumulation. The time evolution of the Lz distribution is shown with various initial optical depths τ0 and a fixed particle radius R = 0.001 (corresponds to 200 m for Chariklo’s rings). Upper row: Mass anomaly of µ = 0.05; lower row: µ = 0.03. Because R is fixed, different values of τ0 correspond to different numbers of particles. The orange curve shows the evolution of the optical depth at the resonance zone, calculated from the number of particles with |a − a0| < Wres (axis labels on the right), while the green curve indicates the excess radial velocity dispersion at the same region (full scale corresponds to a five-fold dispersion compared to unperturbed dispersion). The dashed lines indicate the estimated τlim: for τres < τlim the excitation of resonance perturbations (indicated by the growing oscillations of cres) starts, either initially in the case τ0 ≲ tlim, or after a sufficient drop in τres caused by the initial viscous diffusion. The latter cases are indicated by green arrows and provide an estimate of τlim. Based on the simulations τlim ≈ 0.06 and 0.025 for µ = 0.05 and 0.03, respectively.
Current usage metrics show cumulative count of Article Views (full-text article views including HTML views, PDF and ePub downloads, according to the available data) and Abstracts Views on Vision4Press platform.
Data correspond to usage on the plateform after 2015. The current usage metrics is available 48-96 hours after online publication and is updated daily on week days.
Initial download of the metrics may take a while.